For the past three months, I’ve been conducting the 2026 Utility Staffing Survey. This survey has become a biennial survey, alternating years with the Utility Fee Survey. The initial Utility Staffing Survey was in 2016, followed by additional surveys in 2018, 2020, 2022, and 2024. If you’re interested in comparing years, here are the results from previous Utility Staffing Surveys.
This is the first of two blog posts publishing the results of the 2026 Utility Staffing Survey. Today, we’ll examine the demographics of the survey respondents, staffing levels, and factors outside the utilities’ control. In two weeks, we’ll review staffing levels and practices each utility can control, such as meter reading, bill printing, payment processing, and service orders.
New graphing platform
Rather than the static graphs I’ve used in past surveys, which were created with Excel and Visio, this year I’m using a new product. The charts (now properly called data visualizations or “data vizzes”, as I’m learning) for this year’s survey are created with Tableau Public.
The versions of each graph in this newsletter are static screenshots. However, clicking on any of the graphics will open the interactive data viz in Tableau Public, where you can filter the data shown.
Responses by State
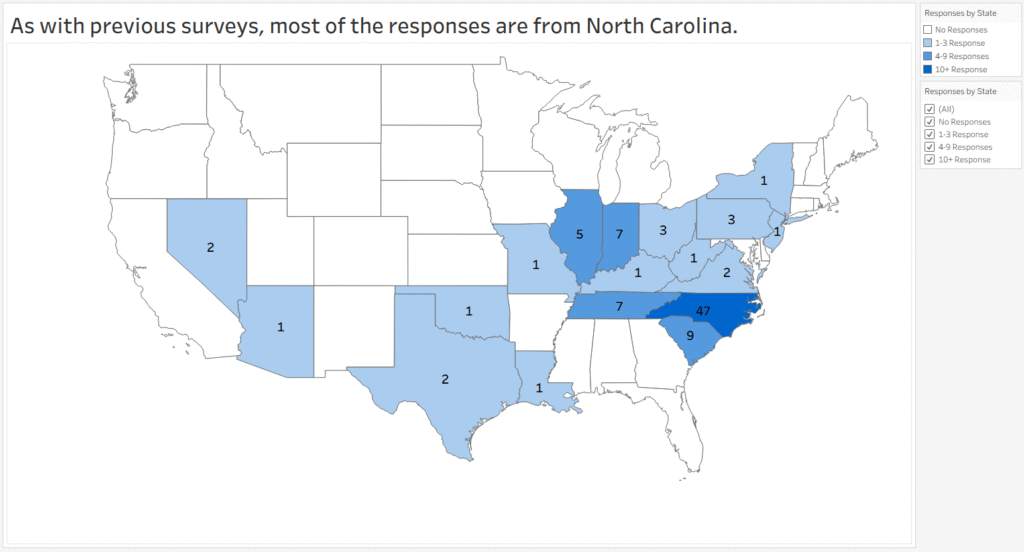
95 utilities from 18 states participated in the survey this year. As has been the case with all previous surveys I’ve conducted, the vast majority of the responses are from North Carolina. I attribute this to two factors.
When I started my email newsletter 15 years ago, I was still with Logics and, at that time, most of our customers were in North Carolina. Therefore, many of my newsletter subscribers are based in North Carolina. Secondly, there are two listservs in North Carolina for water and finance professionals. I participate in both listservs, and posting the survey there generates quite a few responses.
Shown below is a map showing the number of responses by state.
Size of Participating Utilities
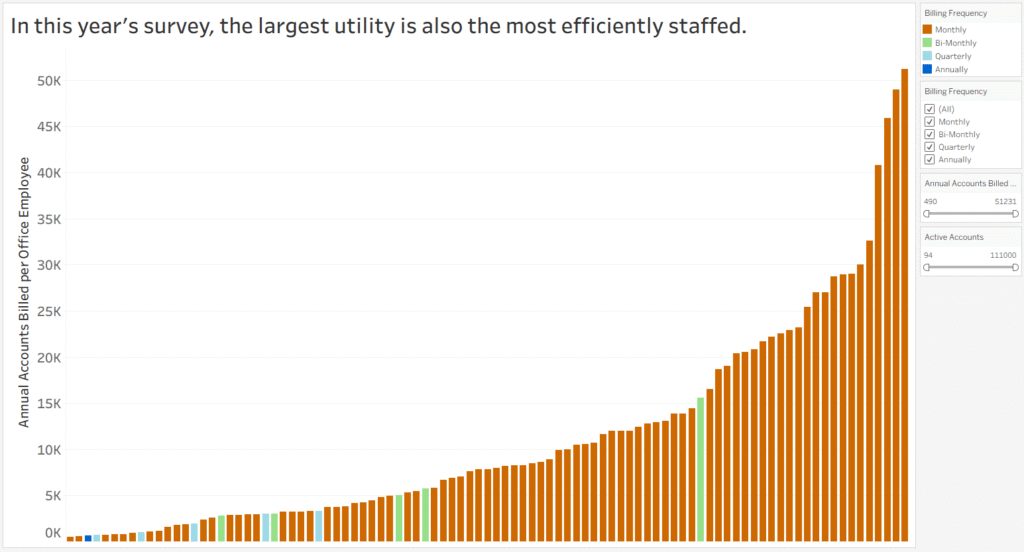
Utilities responding to the survey ranged in size from 94 to 111,000 active accounts, as shown here:
Types of Utilities Responding
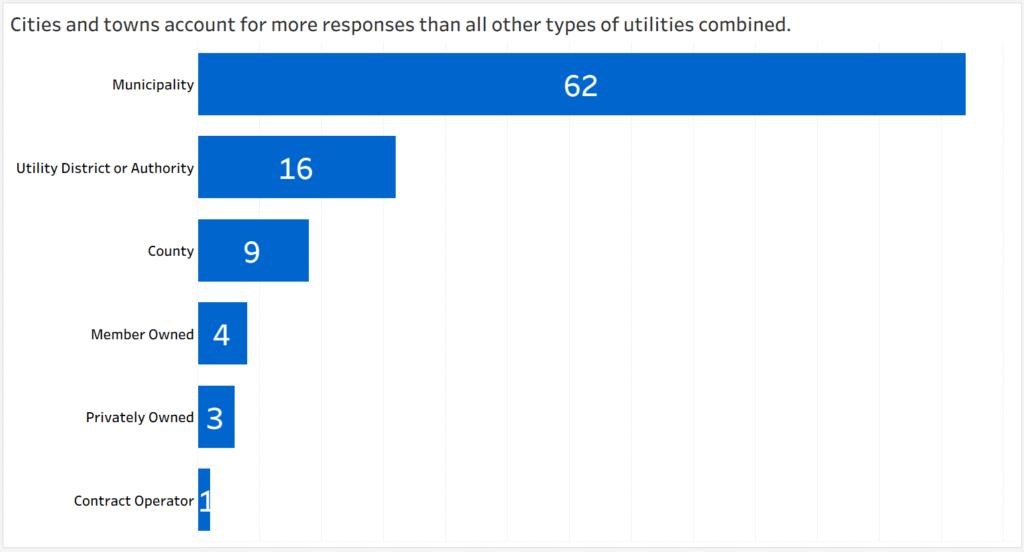
Responses from municipalities make up more than all other types of utilities combined.
Services Provided by Responding Utilities
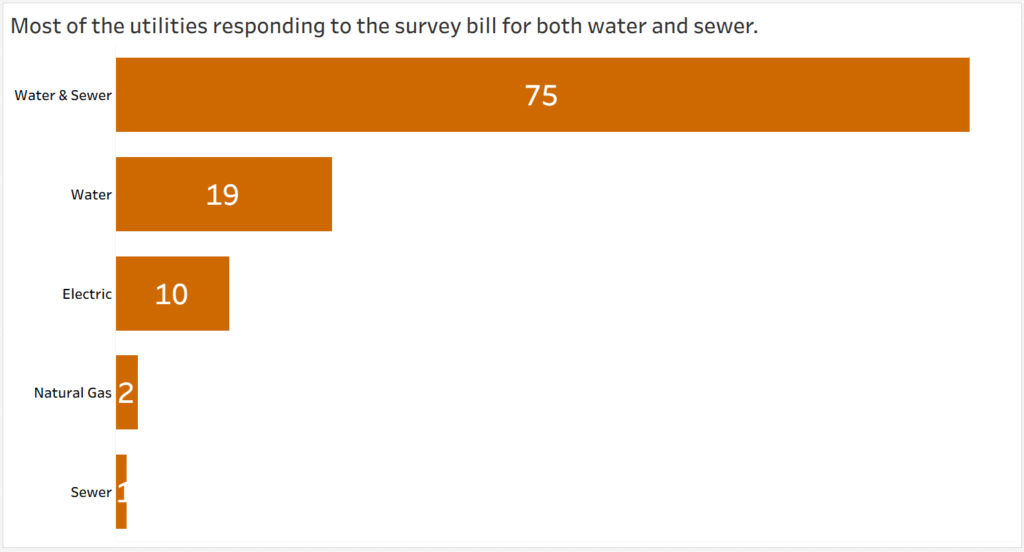
Utilities providing both water and sewer made up the largest segment of responses. Note that the total number of responses exceeds the number of utilities that responded to the survey. This is because some of the responding utilities bill for multiple services.
Positions of Individuals Completing Survey
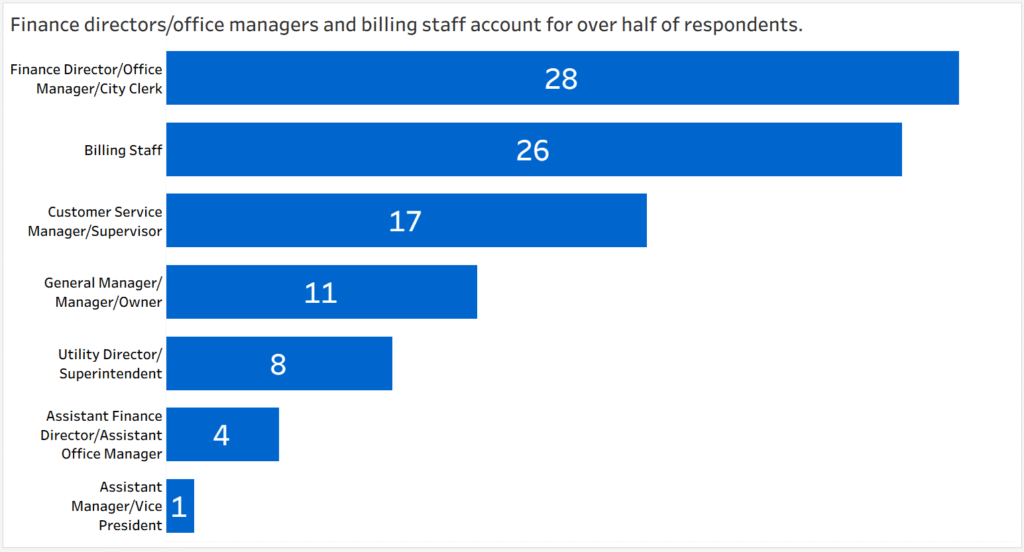
Individuals with a wide variety of roles within their utilities completed the survey. Finance Directors and Office Managers just edged out Billing Staff to the top spot.
Annual Accounts Billed per Office Employee
To arrive at an accurate index for comparing utilities of different sizes and billing frequencies, I derived a value for the number of accounts billed annually per office employee. This formula multiplies the number of active accounts by the number of times each account is billed per year (12 for monthly billing, 6 for bi-monthly billing, 4 for quarterly billing), then divides that product by the total number of office employees. The higher the result, the more efficient the office is considered to be.
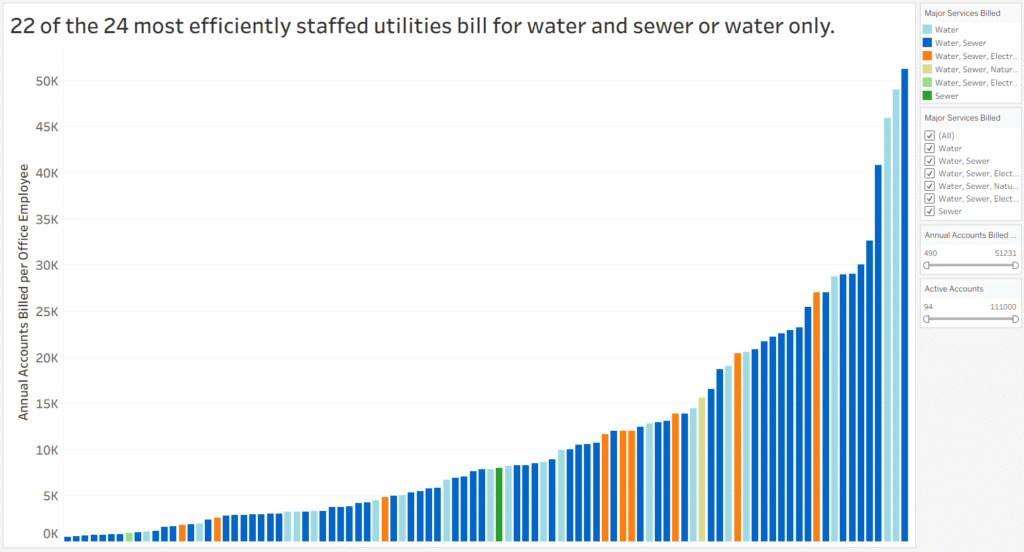
The results ranged from 490 to 51,231, as shown in the graph below.
If you would like to calculate your utility’s Annual Accounts Billed per Office Employee value to see how you compare, I’ve created an online calculator to determine this value. Please click here to calculate your utility’s value.
Major Services Billed
The final variable I examined for this issue was major services billed (water, sewer, electric, and natural gas), looking for a correlation between the number of services billed and office staffing. I only considered the major services because other services, such as garbage, stormwater, or area lights, are generally billed as flat-rate services and are not nearly as labor-intensive to bill.
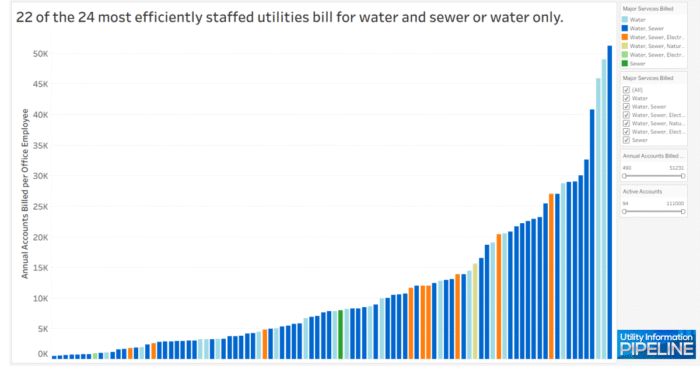
As was the case in prior surveys, utilities billing multiple metered services require more staff than those billing for only a single metered service. This is confirmed in this year’s Utility Staffing Survey, with 22 of the 24 most efficient offices, including the top ten, billing for only water as a metered service, as shown below:
Next issue
In two weeks, we’ll analyze staffing levels and labor-saving practices each utility can control, such as meter reading, bill printing, payment processing, and service orders.
Is your office adequately staffed?
If you think your utility is understaffed or could operate more efficiently, please give me a call at 919-673-4050 or email me at gary@utilityinformationpipeline.com to learn how a business review could help you find out.

© 2026 Gary Sanders