Every other year, in even-numbered years, I conduct the Utility Staffing Survey. This survey examines staffing levels and how utilities handles labor-intensive practices such as meter reading, bill printing, payment processing, and service orders. It also looks for trends as to how more efficiently staffed offices operate. Here are links to previous Utility Staffing Surveys:
2020 Utility Staffing Survey Results
2018 Utility Staffing Survey Results
2016 Utility Staffing Survey Results
The Utility Staffing Survey alternates years with the Utility Fee Survey, which is conducted in odd-numbered years. Below are the results of the 2022 Utility Staffing Survey.
Demographics of survey respondents
88 utilities representing 25 states, ranging in size from 35 to 192,000 active accounts participated in the survey. Click on the links below to see charts of the various demographic data for the survey respondents:
Size of Participating Utilities
Size of Participating Utilities Under 20,000 Accounts
Services Provided by Responding Utilities
Positions of Individuals Completing Survey
Accounts per office employee
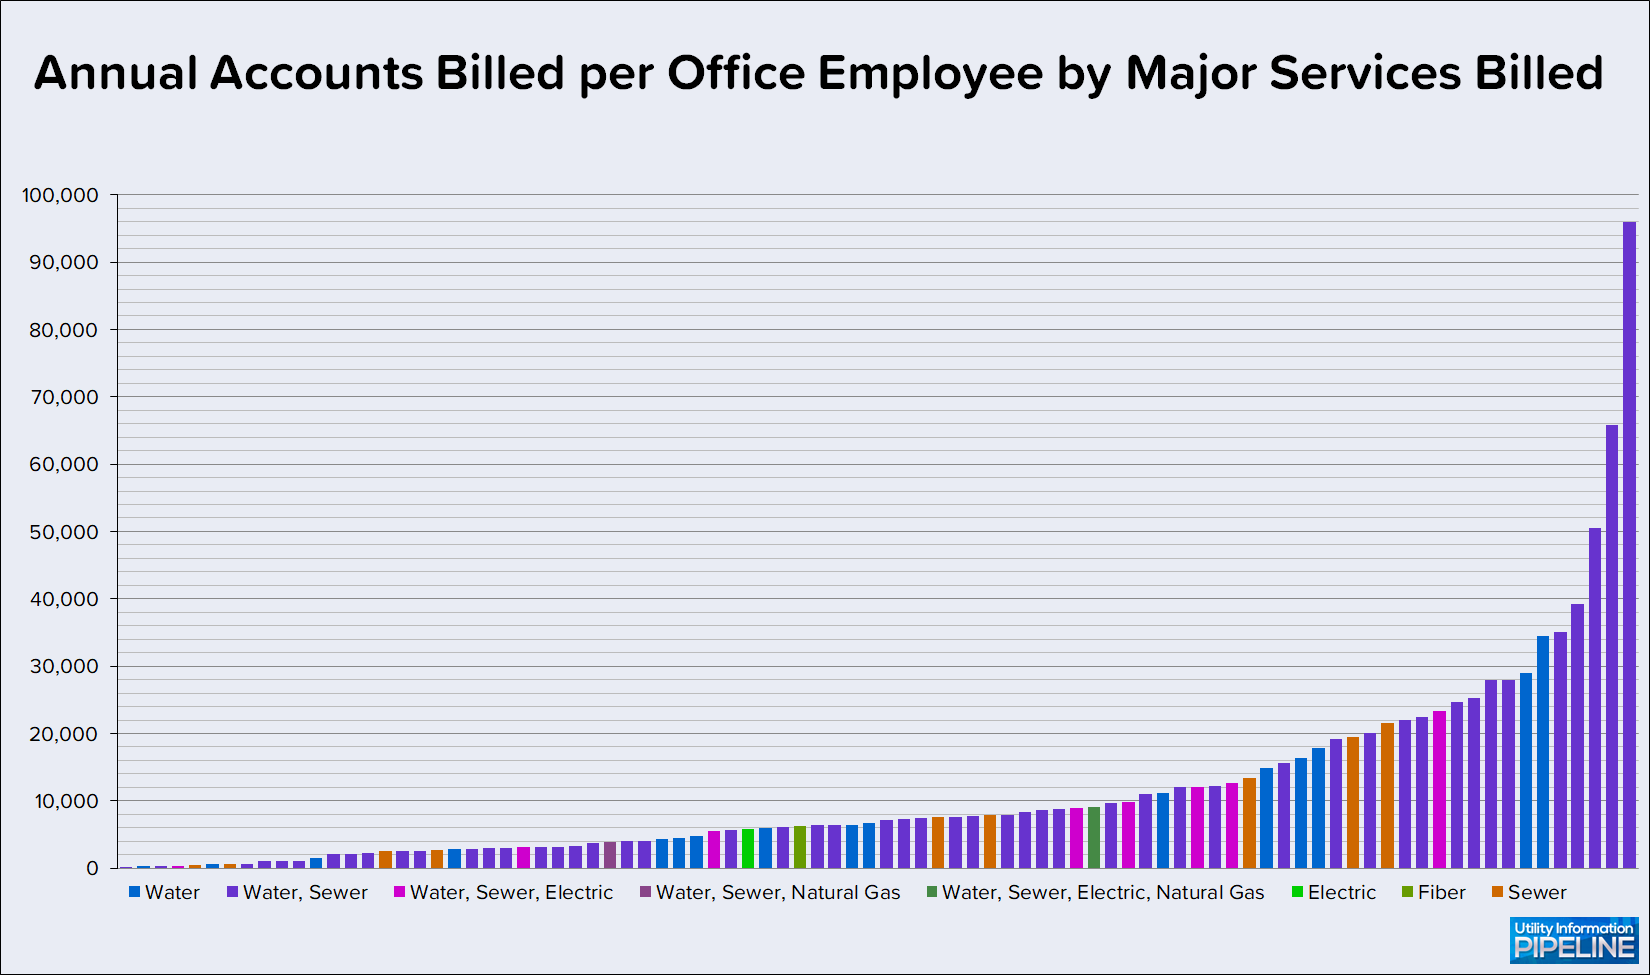
To arrive at an accurate index to compare utilities of differing sizes and billing frequencies, I derived a value for the number of accounts billed annually per office employee. This formula multiplied the number of active accounts by the number of times each account is billed per year (12 for monthly billing, 6 for bi-monthly billing, 4 for quarterly billing) then divided that product by the total number of office employees. The higher the result, the more efficient the office is considered to be.
This year, the most efficient utility was also the most efficient utility in the four years I’ve been conducting the Utility Staffing Survey! The results ranged from 84 to 96,000 as represented by the graph below: (clicking on any of the graphs will open a larger image in a new window).

If you would like to calculate your utility’s Annual Accounts Billed per Office Employee value to see how you compare, I’ve created an online calculator to determine this value. Please click here to calculate your utility’s value.
Annual customer turnover
As with past surveys, I wondered if the turnover in customers would be a factor in how efficiently offices are staffed, so the survey asked how many applications for service (including routine move in/move outs and new construction) each utility processes per year.
Some utilities bill only property owners, and those will have a much lower turnover rate than utilities that bill tenants.
Not surprisingly, as in previous Utility Staffing Surveys, the annual turnover rates ranged widely, from .05% to 67.95%, and appear to have no correlation to staffing levels.

Major services billed
The final variable I examined for this issue was major services billed (water, sewer, electric, natural gas, and, for the first time, fiber optic) looking for a correlation between the number of services billed and office staffing. I only considered the major services, because other services, such as garbage, stormwater, or area lights, generally are billed as flat-rate services and are not nearly as labor-intensive to bill.
As was the case in prior surveys, utilities billing multiple metered services require more staff than those billing for only a single metered service. This is confirmed in this year’s Utility Staffing Survey with 21 of the 22 most efficient offices, including the top 11, billing for only one metered service (three only bill for sewer), as shown below:
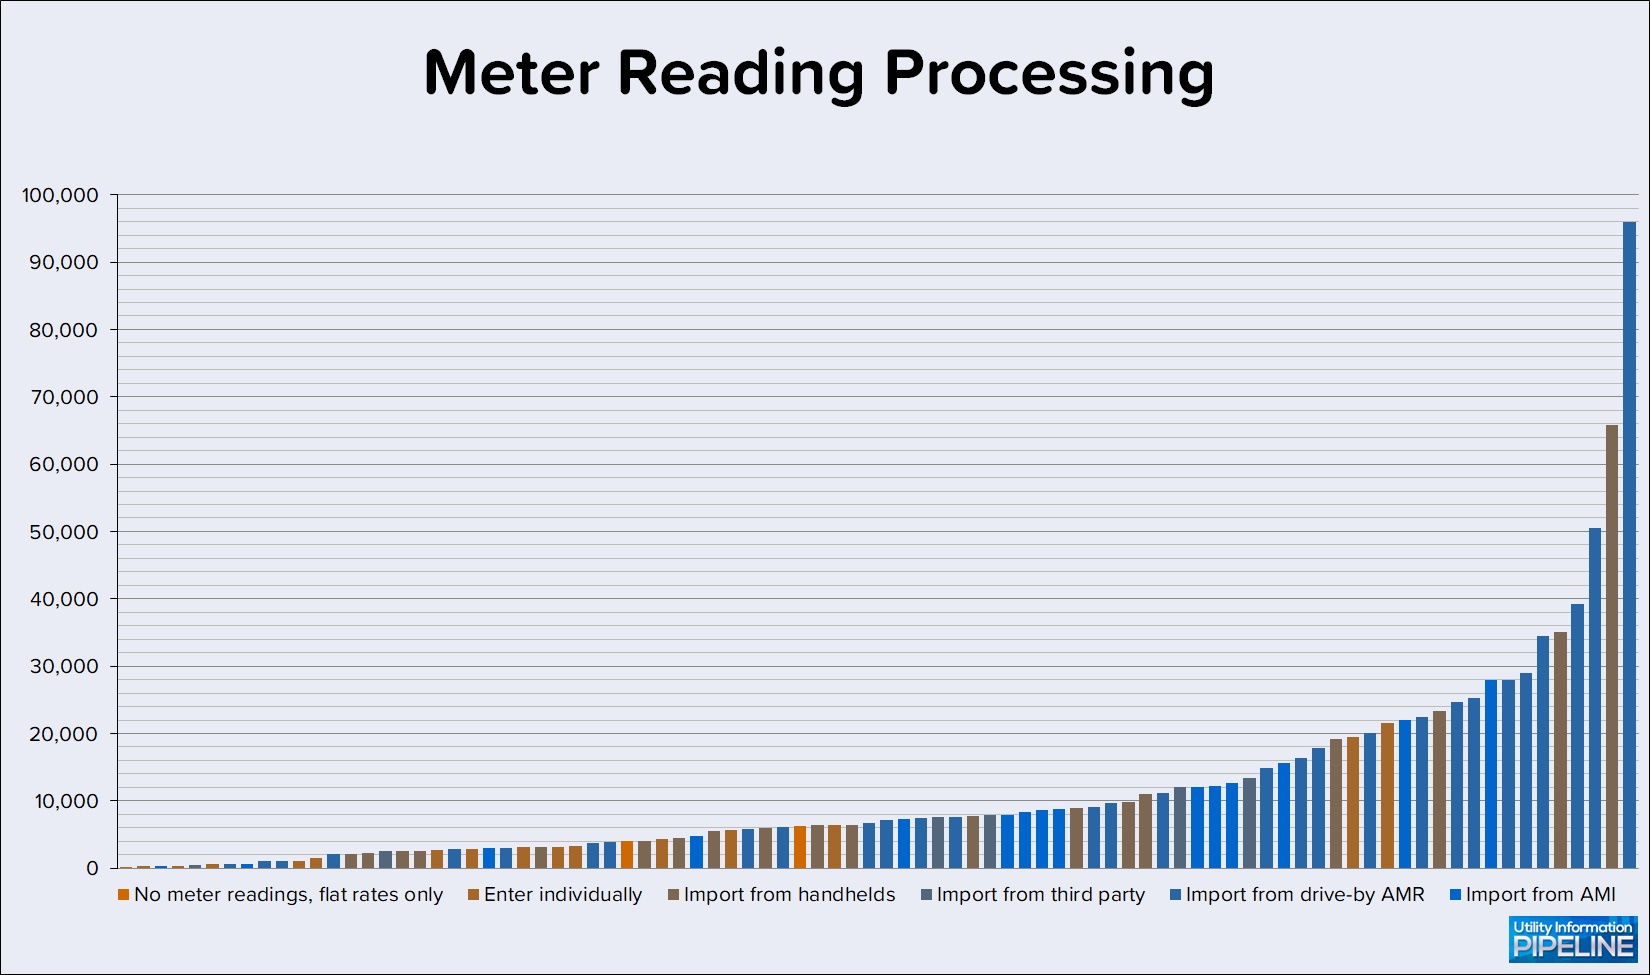
Meter reading processing
In terms of office staffing, the actual time savings with meter readings is only between manually entering readings or importing them from some sort of automated reading process. This year’s survey, in addition to breaking down how readings are imported, also included a category for utilities that only bill flat rates and don’t use meter readings at all.
As anticipated, most utilities responding to the survey have automated their meter reading process. Surprisingly, this year’s survey included 15 utilities that still enter meter readings, up from 13 two years ago. Two of these utilities were in the upper half of most efficiently staffed offices. The others were all within the bottom half of most efficiently staffed offices, as represented by the graph below (clicking on any of the graphs will open a larger image in a new window).
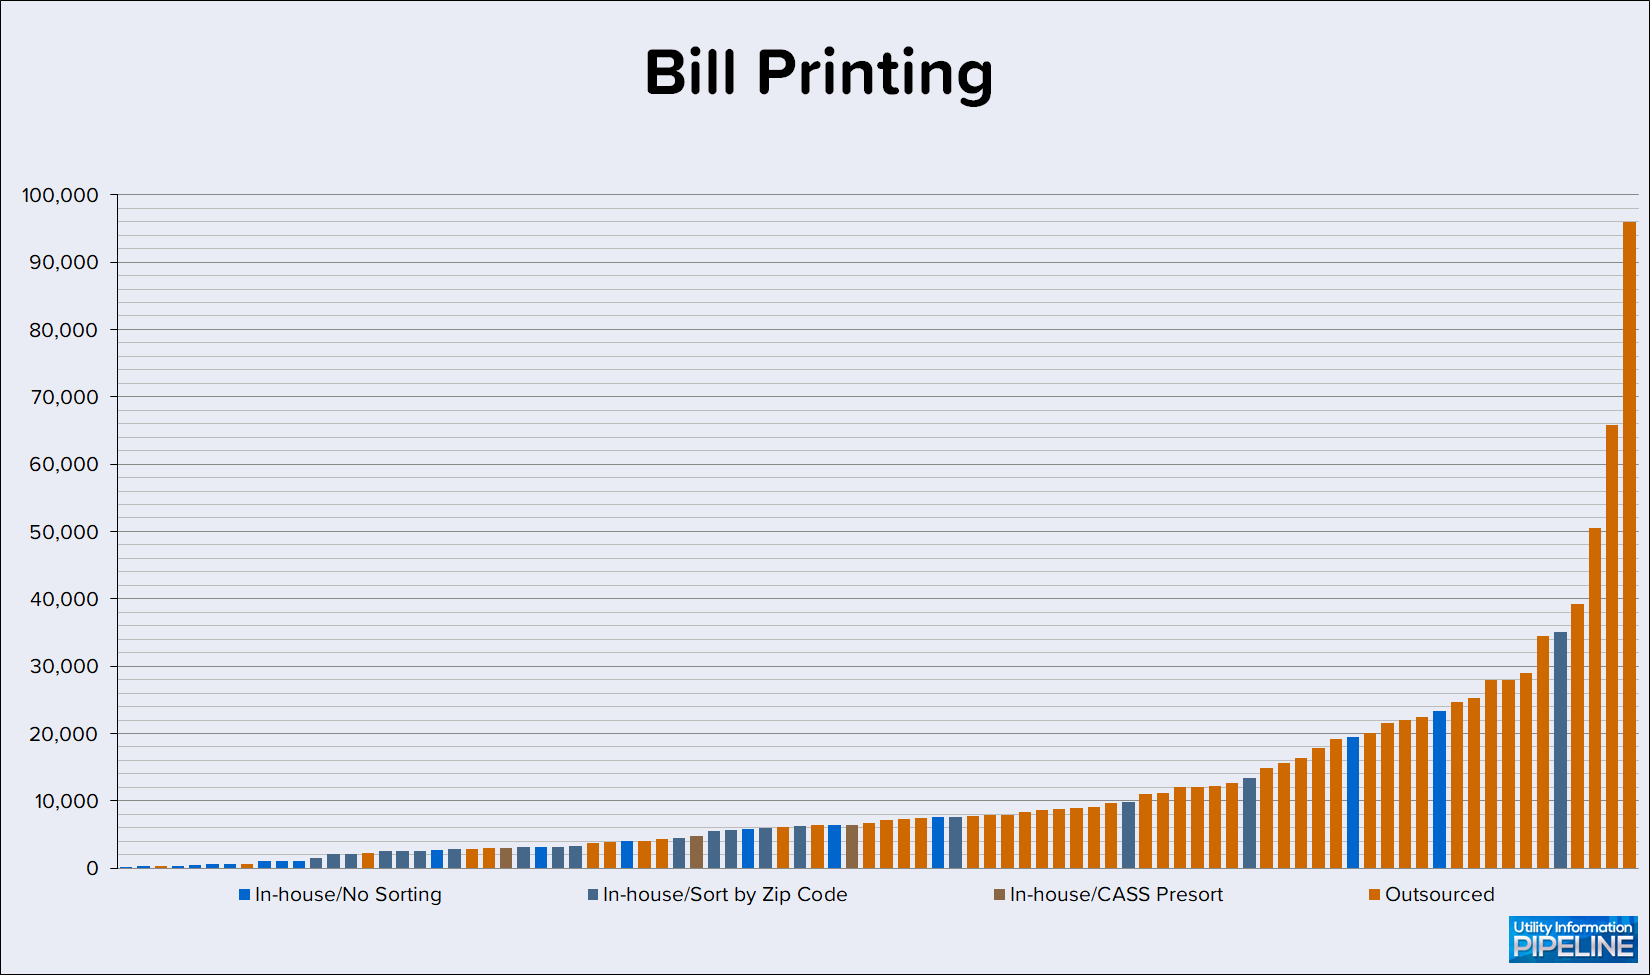
Bill printing
Bill printing and the related tasks required for preparing bills for mailing – separating postcards or folding and inserting full page bills, sorting, and traying the mail – are labor-intensive tasks.
Not surprisingly, the top 4 and 34 of the top 39 most efficiently staffed offices use an outsource printer to print their bills. On the other hand, only three of the 20 least efficiently staffed offices outsource the printing of their bills.
Mail payment processing
Mail payment processing is quite possibly the most laborious process in most utility offices. For that reason, many utilities have sought to automate the processing of mail payments, either by scanning barcodes on the bill, using a remittance processing system or a bank lockbox.
Surprisingly, this year’s survey had the largest number of utilities entering payments by keying them (62.5%) of all four years of the Utility Staffing Survey. The most efficiently staffed office processes mail payments by scanning a bar code. The next six most efficiently staffed offices either use a bank lockbox or a remittance processing system.
11 of the 14 most efficiently staffed utilities automate the mail payment process in some way, while 23 of the 27 least efficiently staffed utilities manually enter mail payments.

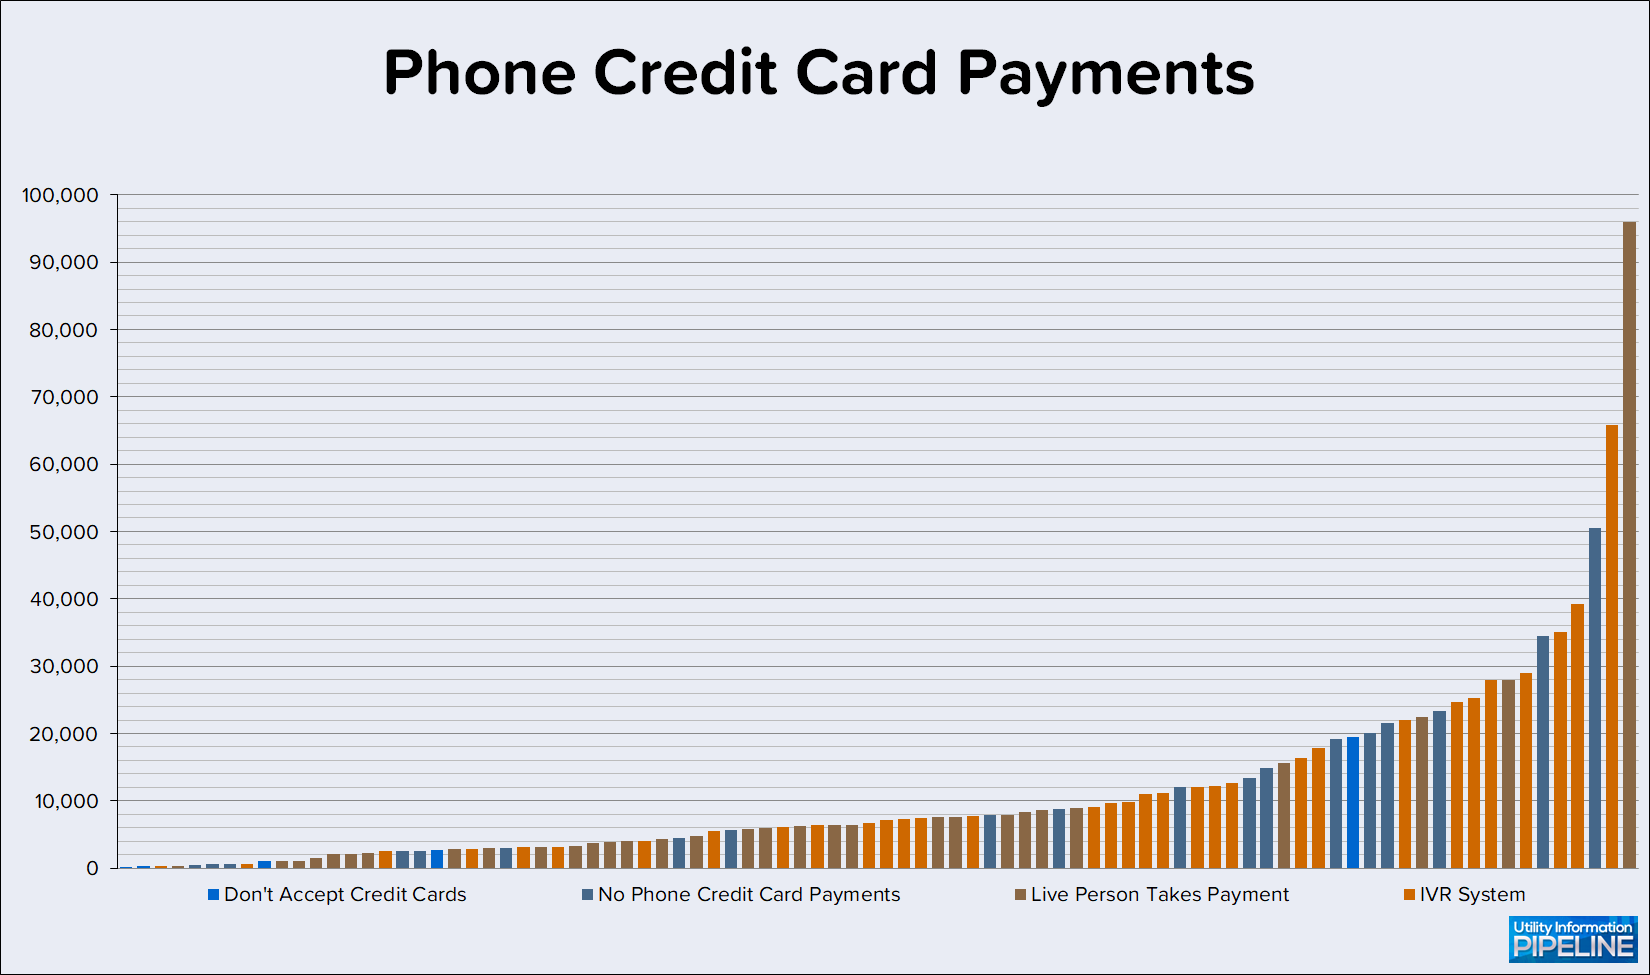
Phone credit card payments
The next area the survey asked about is phone credit card payments. This can be an extremely laborious process considering the customer service representative must look up the account, tell the customer how much is owed, take the credit card number, process the payment authorization and, finally, enter the payment in the system.
Five of the responding utilities don’t accept credit cards and 19 more don’t accept phone credit card payments. Of the rest, the results were almost evenly split between a live person taking the payment (31 responses representing 35.23%) and using an IVR system (33 responses or 37.50%.
One item that stood out to me is that use of an IVR system is the only factor among all of the office processes where there was a consistent, year-over-year increase since the inception of the Utility Staffing Survey. Use of IVR systems has increased each year from 24.66% in 2016 to 37.50% this year.
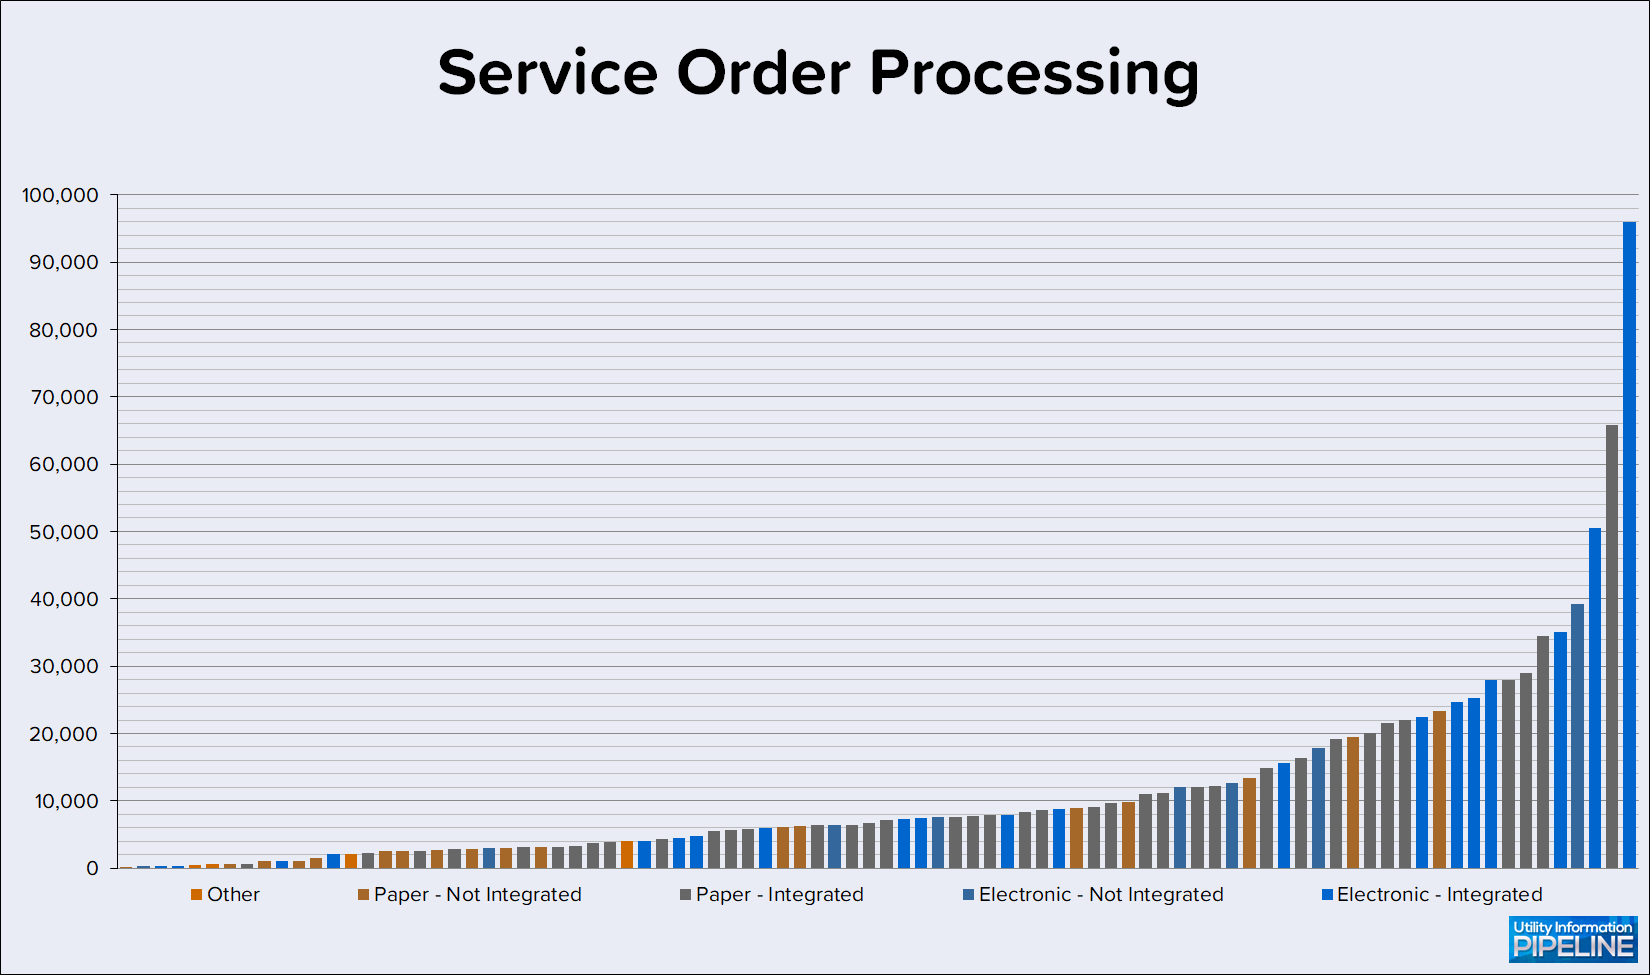
Service order processing
The final area of the survey is service order processing. The survey queried whether utilities used paper or electronic service orders and if they were integrated with the billing software or not.
14 of the 16 most efficiently staffed offices use service orders that are integrated with their billing software, whether paper or electronic. 20 of the 88 utilities, or 22.73%, use electronic service orders integrated with their billing software, up two percentage points from 2020.
Four utilities chose the “Other” response and here are their responses:
- Paper on our end with software, electronic on contractor end
- Take customer’s call and handle the situation
- We don’t process services orders
- We have no service orders
Is your office adequately staffed?
If you think your utility is understaffed or could operate more efficiently, please give me a call at 919-673-4050 or email me at gary@utilityinformationpipeline.com to learn how a business review could help you determine this.