Every other year, in even-numbered years, I conduct the Utility Staffing Survey. This survey examines staffing levels and how utilities handles labor-intensive practices such as meter reading, bill printing, payment processing, and service orders. It also looks for trends as to how more efficiently staffed offices operate. Here are links to other Utility Staffing Surveys:
2022 Utility Staffing Survey Results
2018 Utility Staffing Survey Results
2016 Utility Staffing Survey Results
The Utility Staffing Survey alternates years with the Utility Fee Survey, which is conducted in odd-numbered years. Below are the results of the 2020 Utility Staffing Survey.
Demographics of survey respondents
116 utilities (up from 82 in 2018, a 41.5% increase), representing 20 states, ranging in size from 232 to 285,000 active accounts participated in the survey. Click on the links below to see charts of the various demographic data for the survey respondents:
Size of utilities under 20,000 accounts responding
Services provided by responding utilities
Positions of individuals completing survey
Accounts per employee
To arrive at an accurate index to compare utilities of differing sizes and billing frequencies, I derived a value for the number of accounts billed annually per employee. This formula multiplied the number of active accounts by the number of times each account is billed annually (12 for monthly billing, 6 for bi-monthly billing, 4 for quarterly billing) then divided that product by the total number of office employees. The higher the result, the more efficient the office is considered to be.
Surprisingly, two utilities this year were more efficient than the most efficient utilities in either 2016 or 2018. The results ranged from 408 to 69,818 as represented by the graph below: (clicking on any of the graphs will open a larger image in a new window).
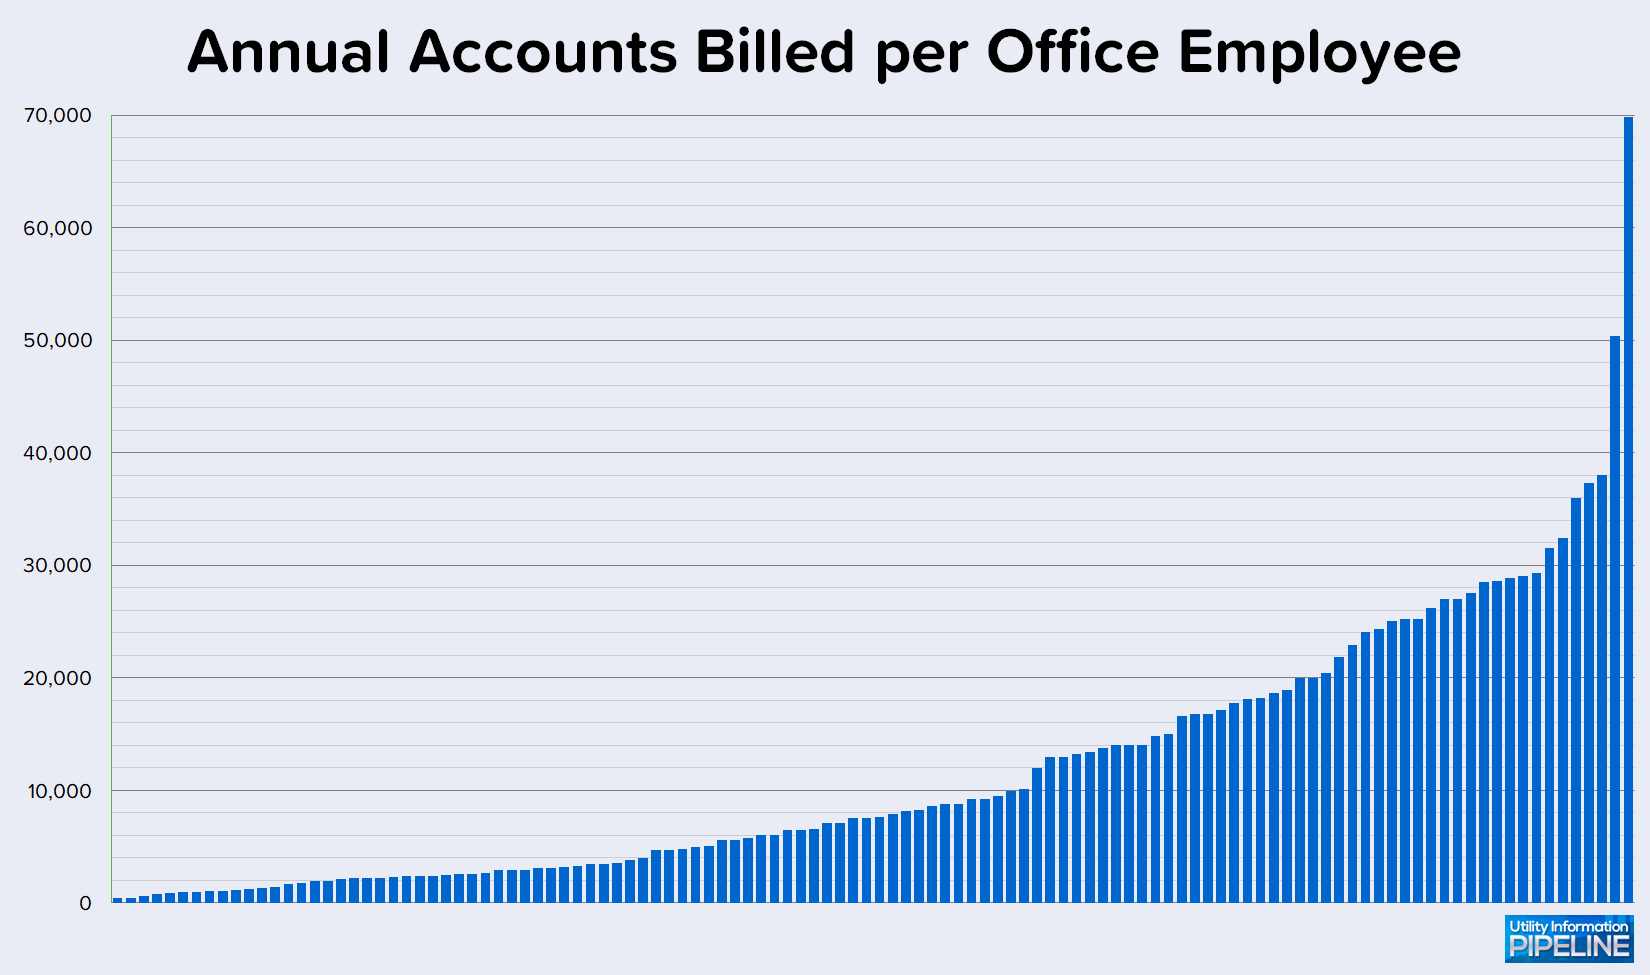
If you’re playing along at home and would like to calculate your utility’s Annual Accounts Billed per Office Employee value, I’ve created an online calculator to determine this value. Please click here to calculate your utility’s value.
Annual customer turnover
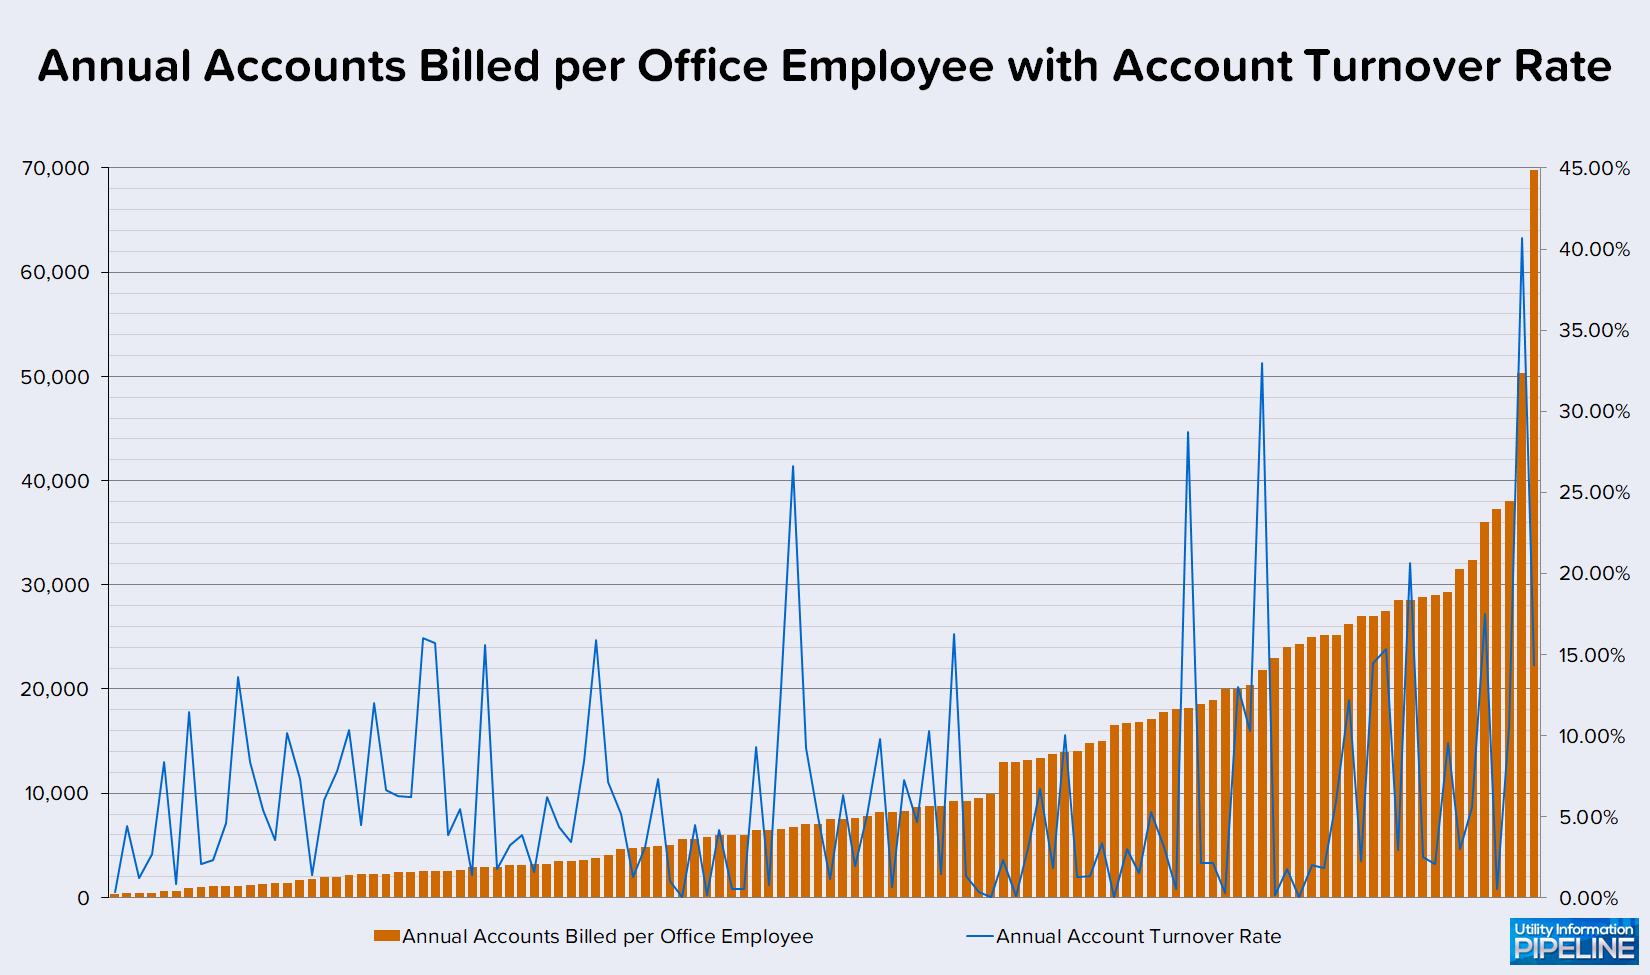
As with past surveys, I wondered if the turnover in customers would be a factor in how efficiently offices are staffed, so the survey asked how many applications for service (including routine move in/move outs and new construction) each utility processes per year.
Some utilities bill only property owners, and those will have a much lower turnover rate than utilities that bill tenants.
Not surprisingly, the annual turnover rates ranged widely, from .01% to 40.66%. I have a suspicion that some of the turnover rates may be artificially low because respondents may have interpreted the question to only include new construction. (I’ve made a note to myself to include a more verbose explanation for this question in 2022!)
Interestingly, the second most efficiently staffed office has the highest annual turnover rate!
Major services billed
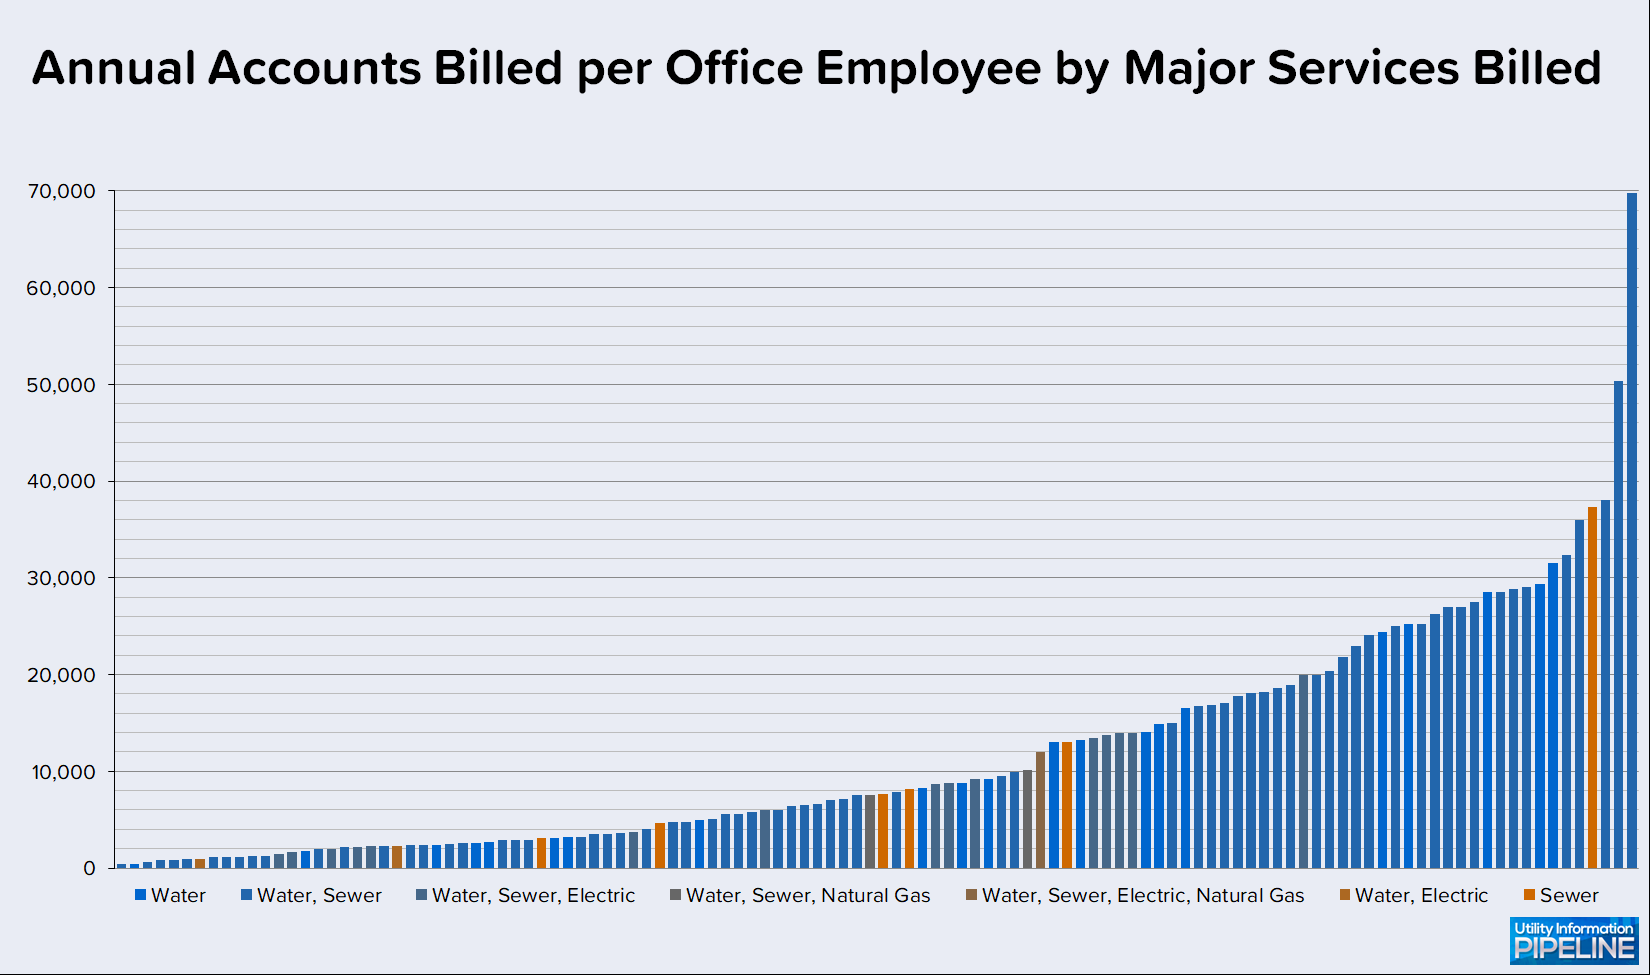
The final variable I examined for this issue was major services billed (water, sewer, electric, and natural gas) looking for a correlation between the number of services billed and office staffing. I only considered the major services, because other services, such as garbage, stormwater, or area lights, generally are billed as flat-rate services and are not nearly as labor-intensive to bill.
As was the case in 2016 and 2018, utilities billing multiple metered services require more staff than those billing for only a single metered service. This was even more convincing this year, as 37 of the 38 most efficient offices (including the top 25) bill for only one metered service or less (one bills for sewer only), as shown below:
Meter reading processing
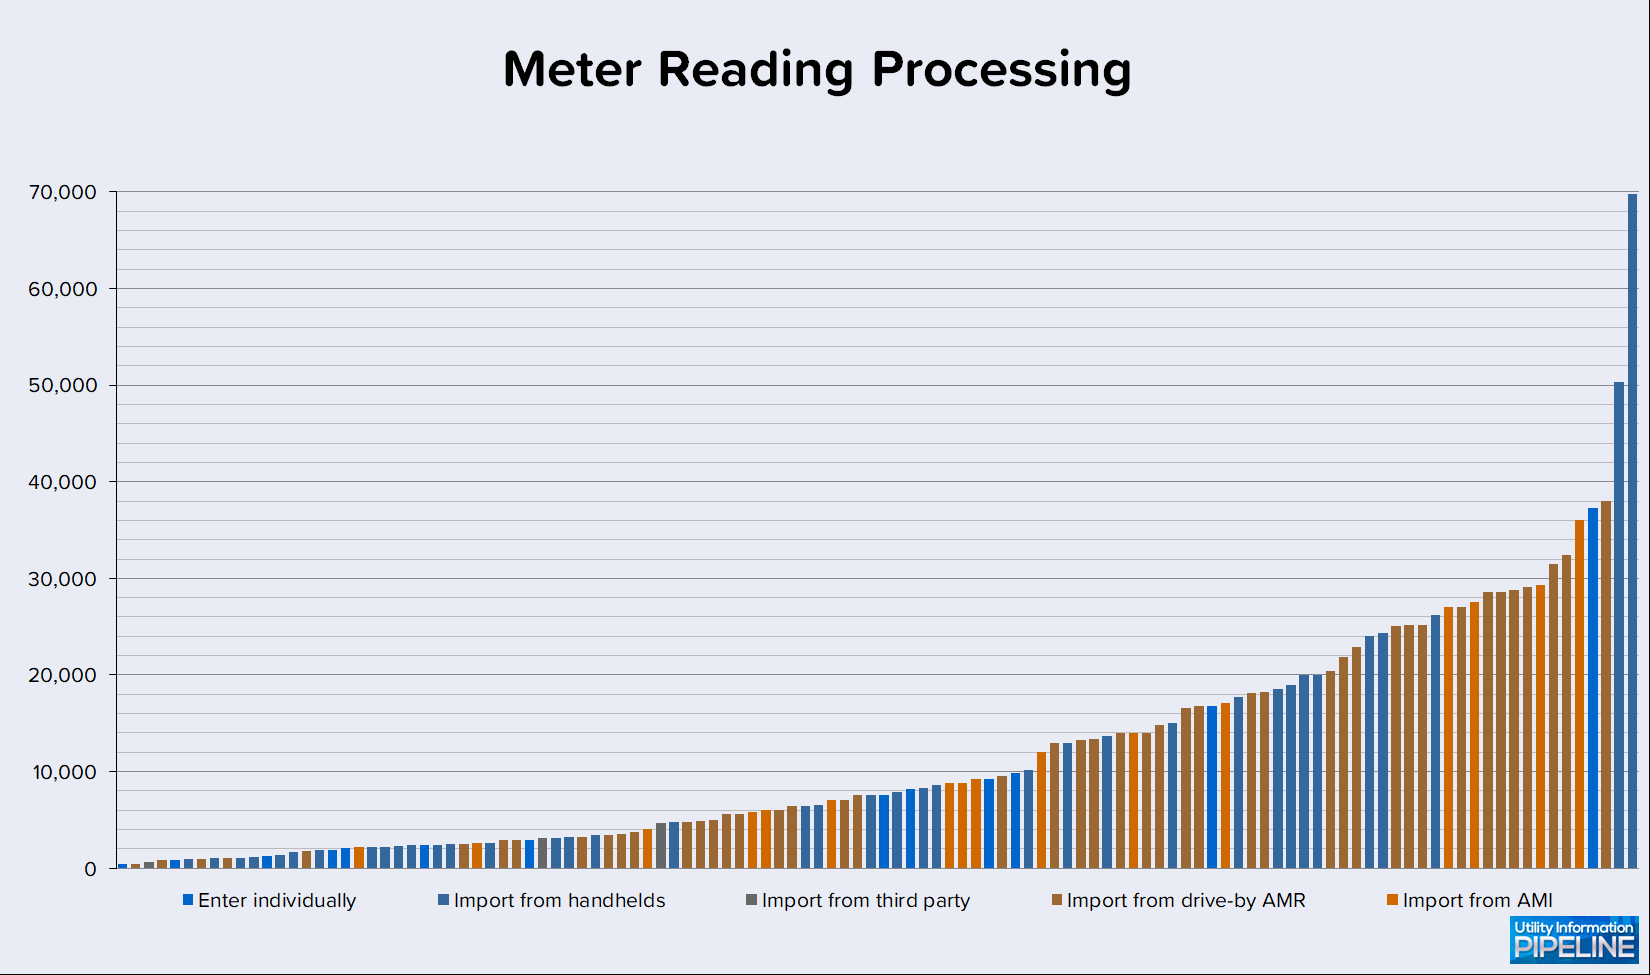
In terms of office staffing, the real distinction in time savings with meter readings is only between manually entering readings or importing them from some sort of automated reading process. However, like two years ago, this year’s survey again distinguished between whether the imported readings were from handhelds, another utility, or an AMR or AMI system.
As expected, most utilities in the survey have automated their meter reading process. However, this year’s survey included 13 utilities that still enter meter readings, down from 16 two years ago. Surprisingly, six of these utilities were in the upper 50% of most efficiently staffed offices, and one is in the top four! The others were all within the bottom half of least efficiently staffed offices, as represented by the graph below (clicking on any of the graphs will open a larger image in a new window).
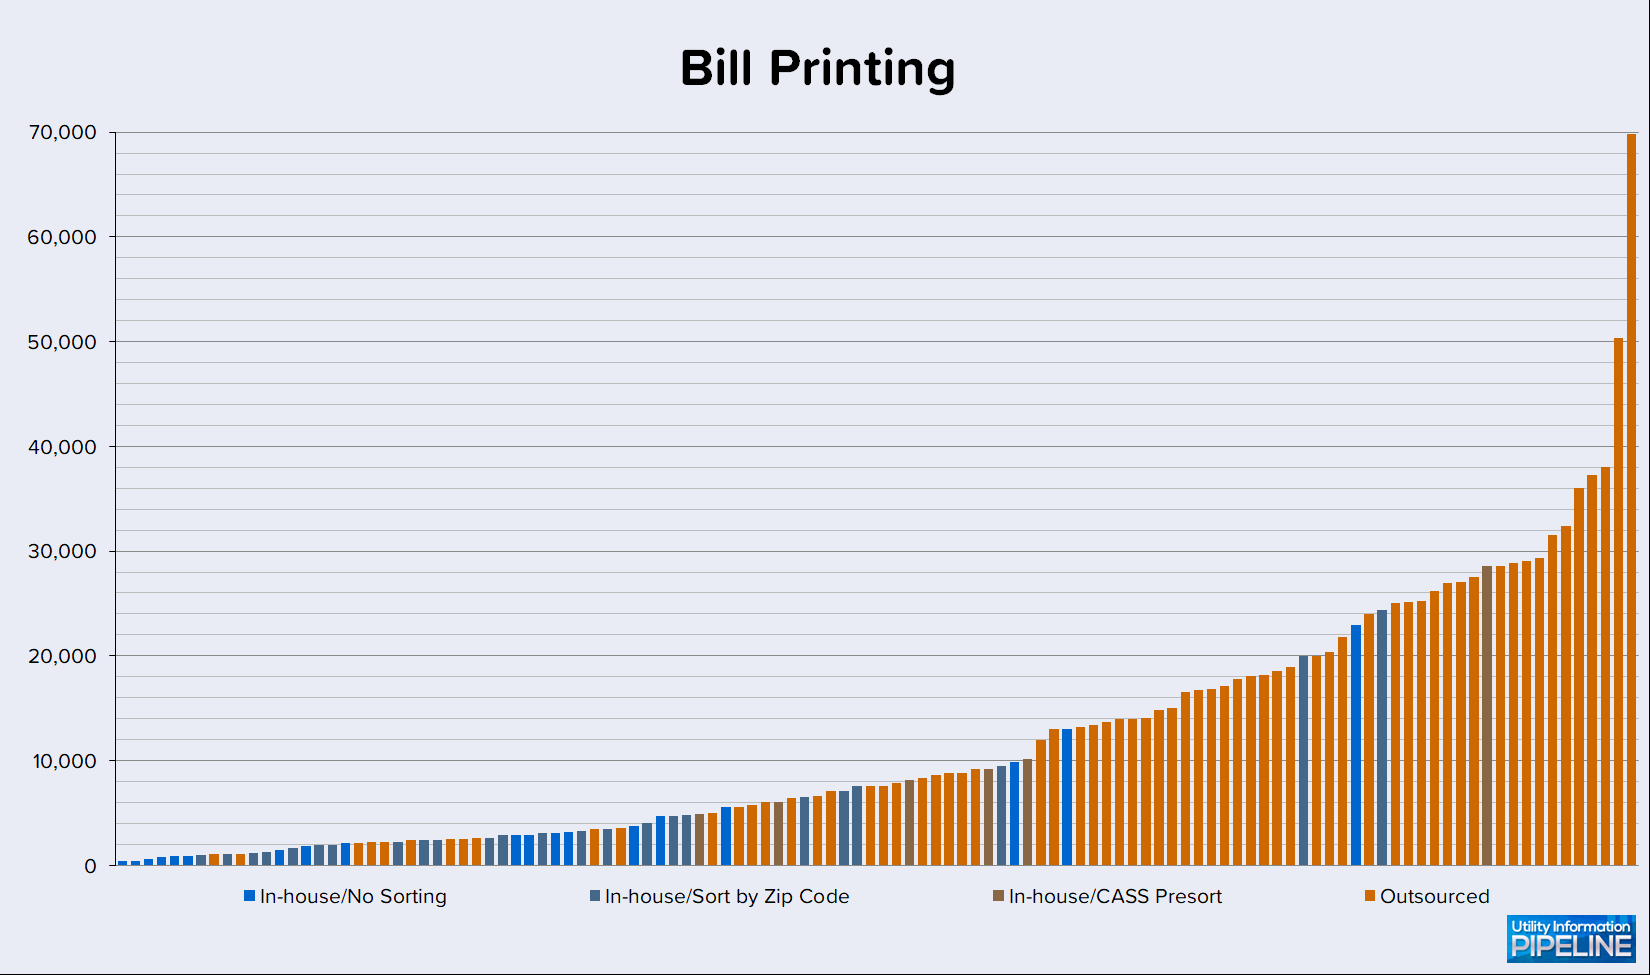
Bill printing
Bill printing and the related tasks required for preparing bills for mailing – separating postcards or folding and inserting full page bills, sorting, and traying the mail – are very labor-intensive tasks.
Not surprisingly, the top 11 and 39 of the top 43 most efficiently staffed offices use an outsource printer to print their bills. On the other hand, only two of the 18 least efficiently staffed offices outsource their billing printing.
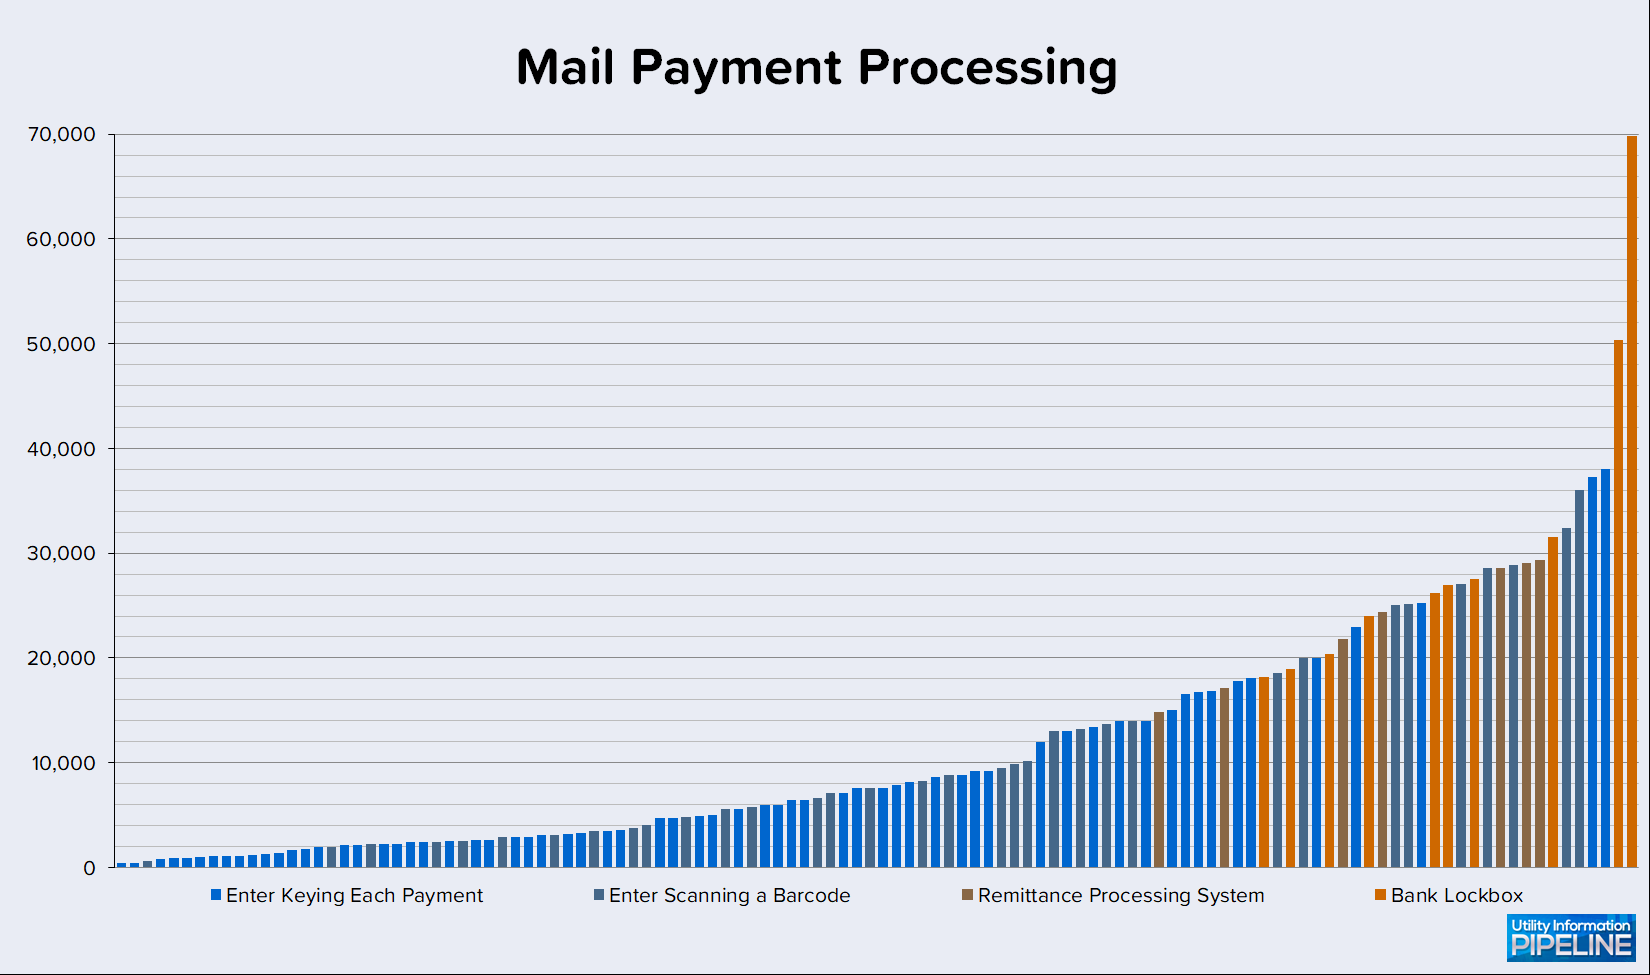
Mail payment processing
Mail payment processing is quite possibly the most laborious process in most utility offices. For that reason, many utilities have sought to automate the processing of mail payments, either by scanning barcodes on the bill, or using a remittance processing system or a bank lockbox.
Surprisingly, two of the four most efficiently staffed offices still manually enter payments. However, 14 of the 16 most efficiently staffed utilities automate the mail payment process in some way, while 21 of the 24 least efficient utilities manually enter mail payments.
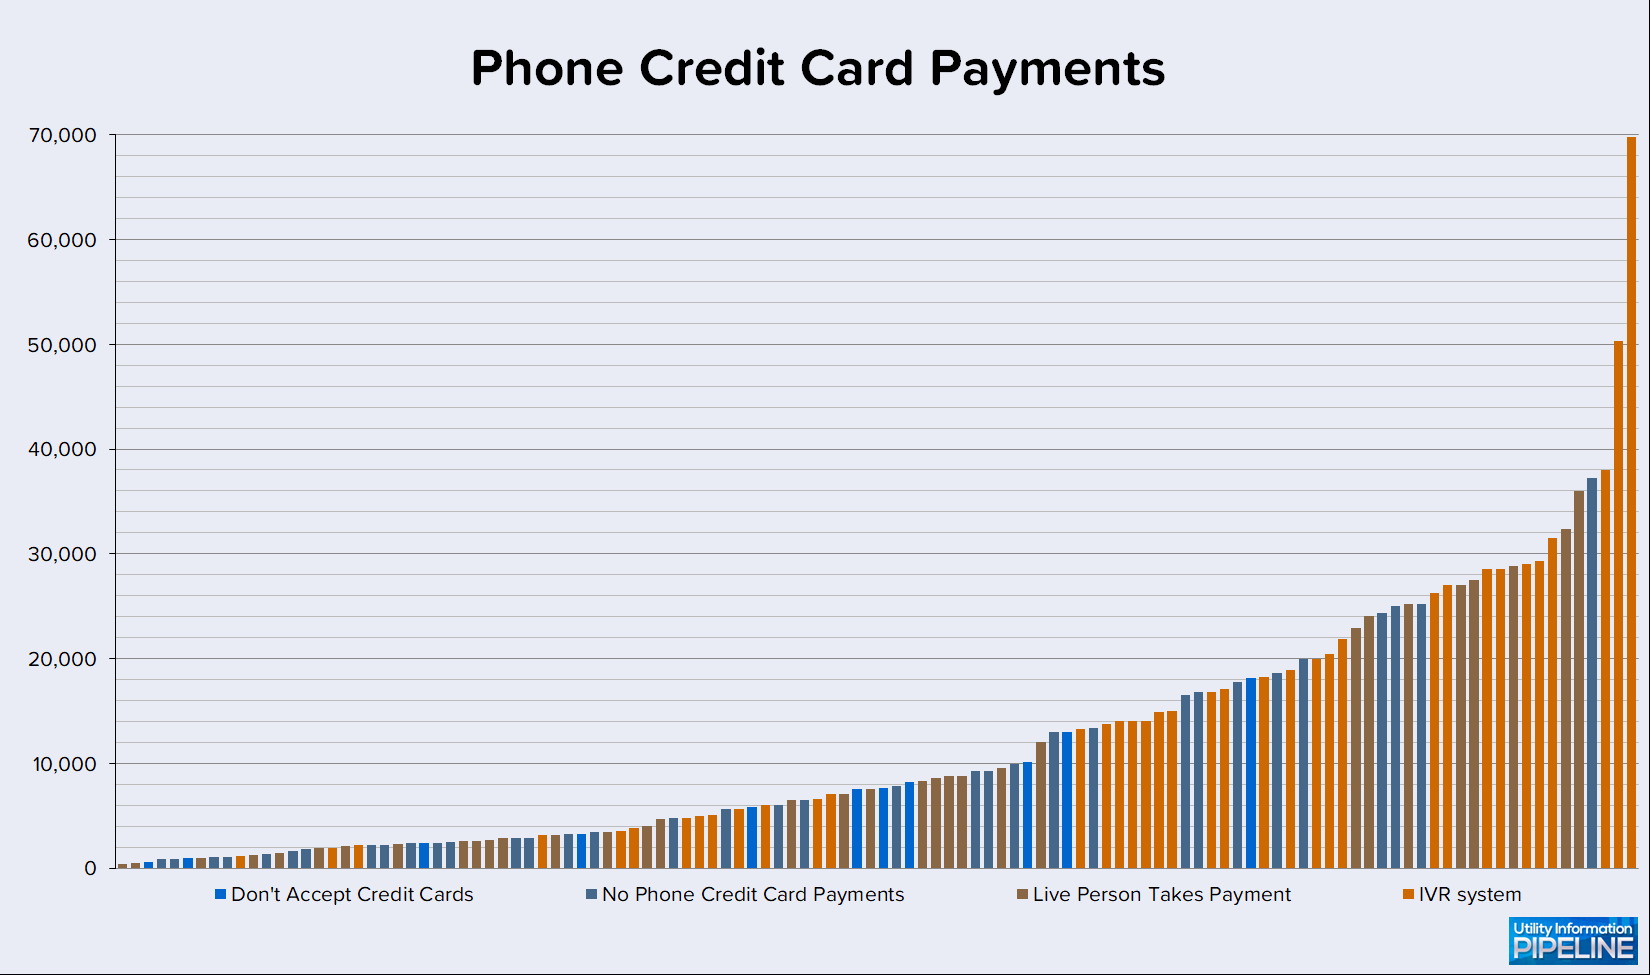
Phone credit card payments
The next area the survey asked about is phone credit card payments. This can be an extremely laborious process considering the customer service representative must look up the account, tell the customer how much is owed, take the credit card number, process the payment authorization and, finally, enter the payment in the system.
Somewhat surprisingly, 8 of the 22 most efficiently staffed offices have a person in the office take phone credit card payments.
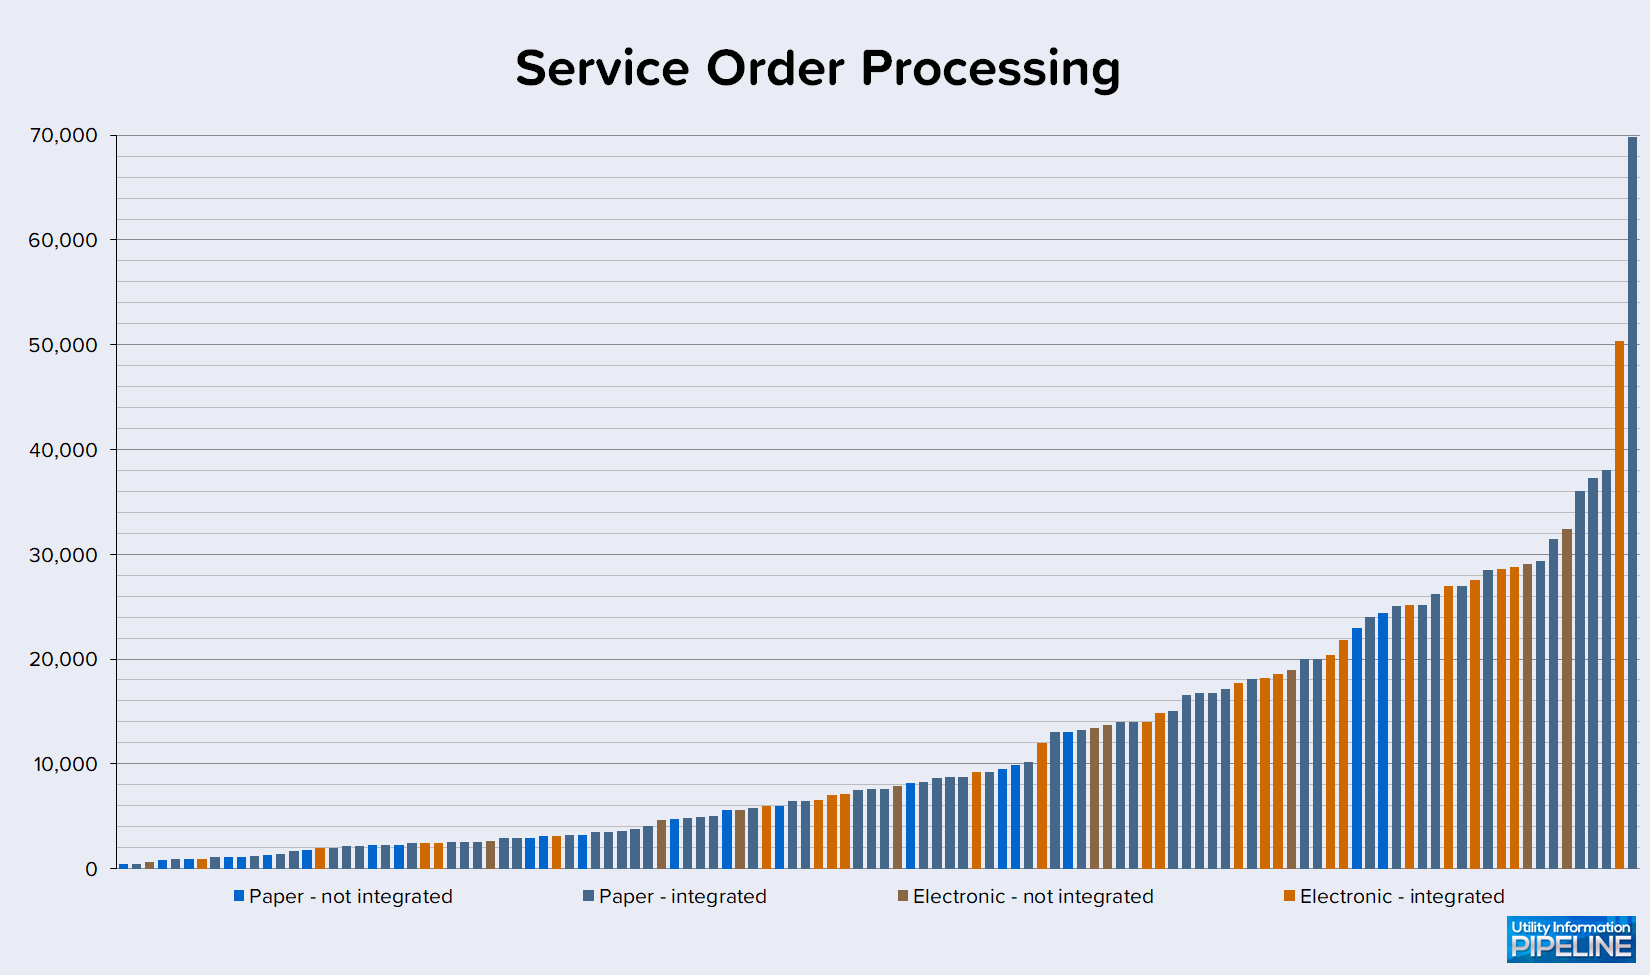
Service order processing
The final area, and new to this year’s survey, is service order processing. The survey queried whether utilities used paper or electronic service orders and if they were integrated with the billing software or not.
Somewhat surprisingly, the most efficiently staffed office, and six of the top eight utilities, continue to use paper service orders. 24 of the 116 utilities, or 20.7%, use electronic service orders integrated with their billing software. This is a trend I anticipate will increase with future surveys.
Is your office adequately staffed?
If you think your utility is understaffed or could operate more efficiently, please give me a call at 919-673-4050 or e-mail me at gary@utilityinformationpipeline.com to learn how a business review could help you determine this.