Every other year, in even-numbered years, I conduct the Utility Staffing Survey. This survey examines staffing levels and how utilities handle labor-intensive practices such as meter reading, bill printing, payment processing, and service orders. It also looks for trends as to how more efficiently staffed offices operate. Here are links to previous Utility Staffing Surveys:
2024 Utility Staffing Survey Results
2022 Utility Staffing Survey Results
2020 Utility Staffing Survey Results
2018 Utility Staffing Survey Results
2016 Utility Staffing Survey Results
The Utility Staffing Survey alternates years with the Utility Fee Survey, which is conducted in odd-numbered years. Below are the results of the 2026 Utility Staffing Survey.
New graphing platform
Rather than the static graphs I’ve used in past surveys, which were created with Excel and Visio, this year I’m using a new product. The charts (now properly called data visualizations or “data vizzes”, as I’m learning) for this year’s survey are created with Tableau Public.
The versions of each graph on this page are static screenshots. However, clicking on any of the graphics will open the interactive data viz in Tableau Public, where you can filter the data shown.
Demographics of survey respondents
95 utilities representing 18 states, ranging in size from 94 to 111,000 active accounts, participated in the survey. Click on any of the links below to see charts of the various demographic data for the survey respondents:
Size of Participating Utilities
Services Provided by Responding Utilities
Positions of Individuals Completing Survey
Annual accounts billed per office employee
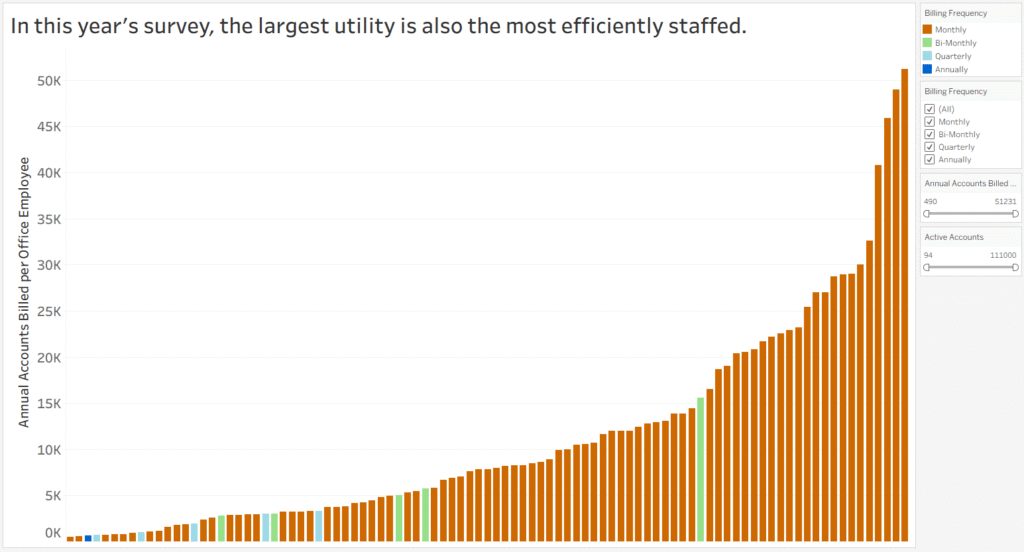
To arrive at an accurate index for comparing utilities of different sizes and billing frequencies, I derived a value for the number of accounts billed annually per office employee. This formula multiplies the number of active accounts by the number of times each account is billed per year (12 for monthly billing, 6 for bi-monthly billing, 4 for quarterly billing), then divides that product by the total number of office employees. The higher the result, the more efficient the office is considered to be.
The results ranged from 490 to 51,231, as shown in the graph below.
If you would like to calculate your utility’s Annual Accounts Billed per Office Employee value to see how you compare, I’ve created an online calculator to determine this value. Please click here to calculate your utility’s value.
Major Services Billed
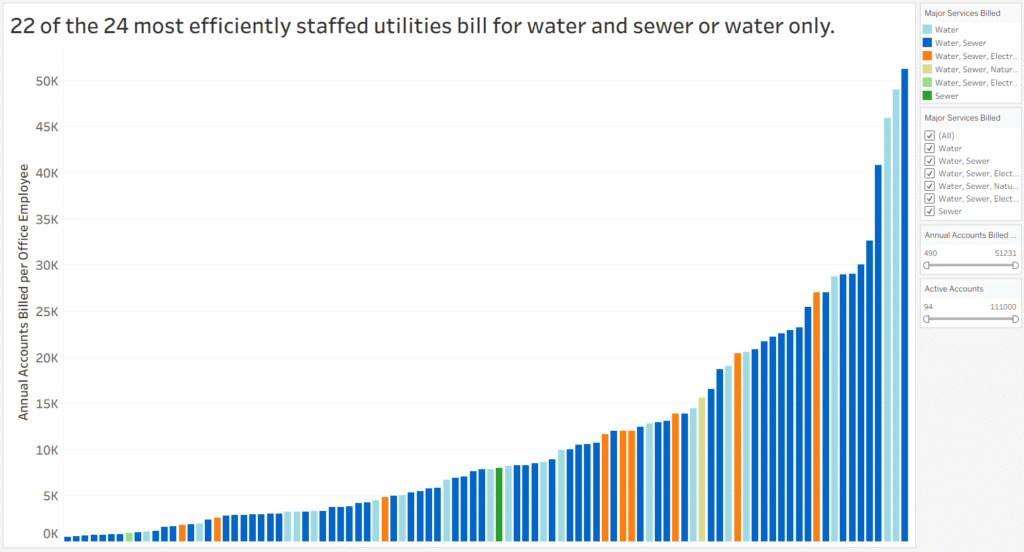
The final variable I examined for this issue was major services billed (water, sewer, electric, and natural gas), looking for a correlation between the number of services billed and office staffing. I only considered the major services because other services, such as garbage, stormwater, or area lights, are generally billed as flat-rate services and are not nearly as labor-intensive to bill.
As was the case in prior surveys, utilities billing multiple metered services require more staff than those billing for only a single metered service. This is confirmed in this year’s Utility Staffing Survey, with 22 of the 24 most efficient offices, including the top ten, billing for only water as a metered service, as shown below:
Meter reading processing
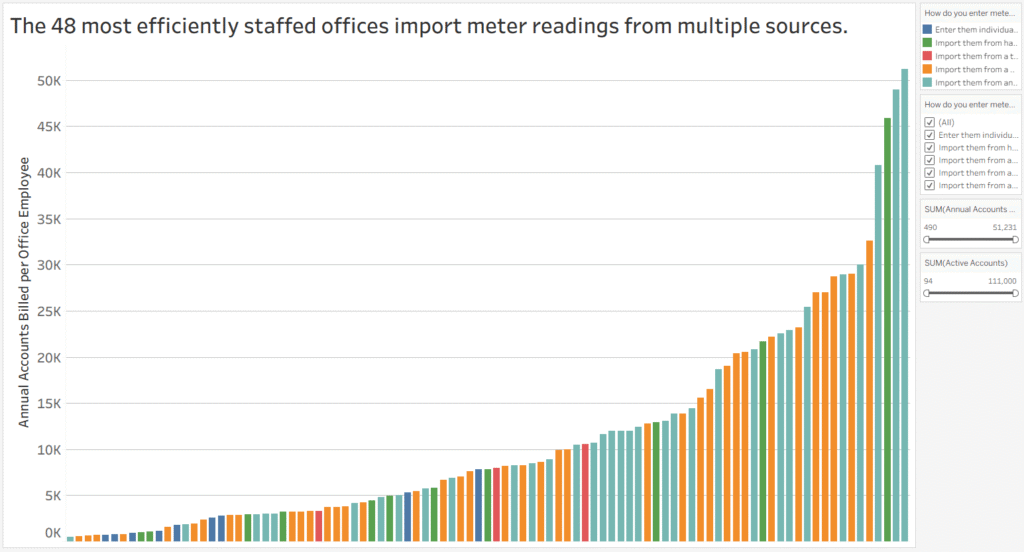
In terms of office staffing, the actual time savings with meter readings is only between manually entering readings or importing them from some sort of automated reading process.
As anticipated, most utilities that responded to the survey have automated their meter reading process. This year’s survey included nine utilities that still enter meter readings (representing 9.5% of responding utilities), down from 10 two years ago. Understandably, all nine of these utilities were in the bottom half of the most efficiently staffed offices, as shown in the graph below.
Meanwhile, AMI systems continue to gain popularity, with 33 utilities (34.7%) importing readings from AMI systems. This is up from 25.6% two years ago.
Bill printing
Bill printing and the related tasks required for preparing bills for mailing – separating postcards or folding and inserting full-page bills, sorting, and traying the mail – are labor-intensive tasks.
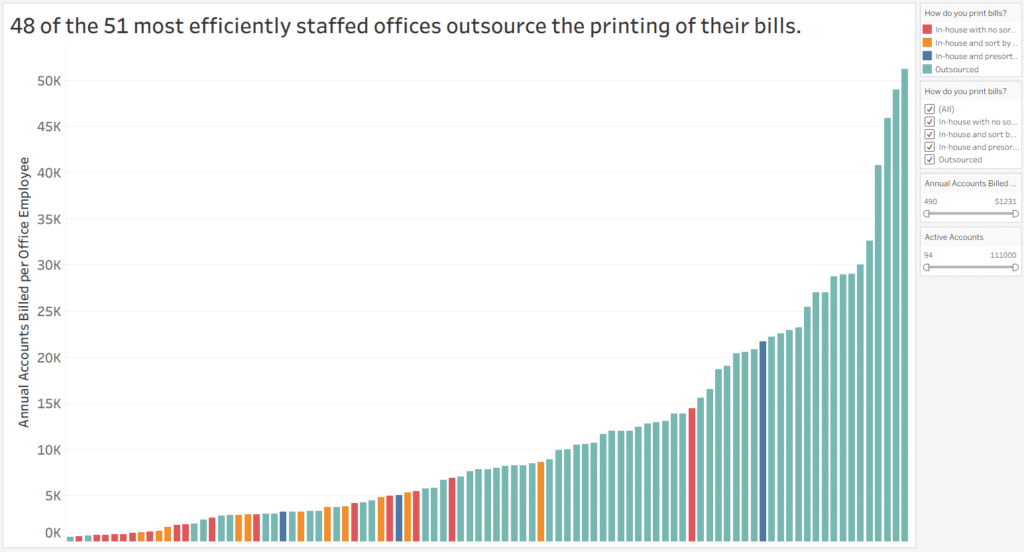
Outsourcing of bill printing continues to grow in popularity, with 65 utilities (68.4%) outsourcing the printing of their bills. Not surprisingly, the top 16 and 48 of the top 51 most efficiently staffed offices use an outsource printer to print their bills, as shown below:
Mail payment processing
Mail payment processing is quite possibly the most laborious process in most utility offices. For that reason, many utilities have sought to automate the processing of mail payments, either by scanning barcodes on the bill, using a remittance processing system, or a bank lockbox.
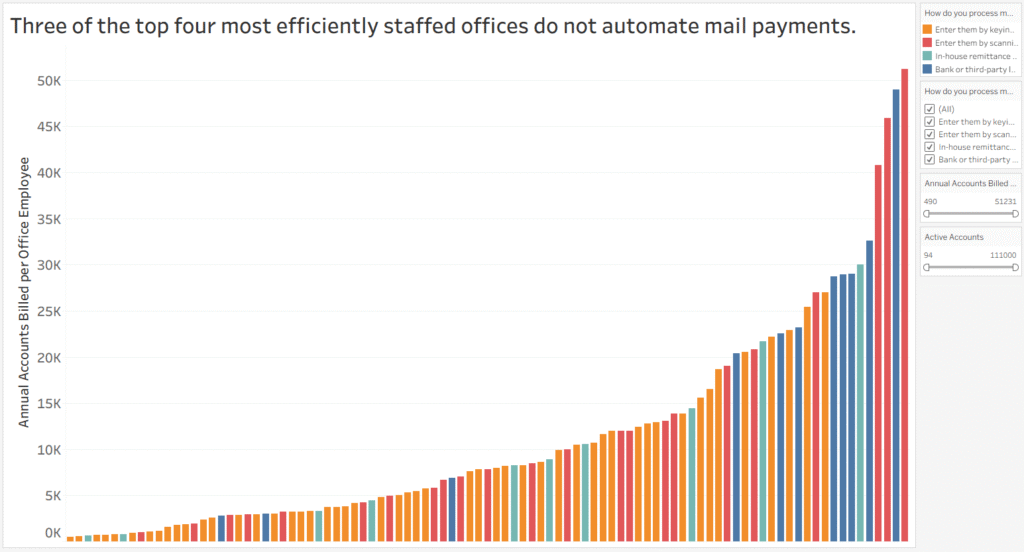
Interestingly, a considerable number of utilities still enter payments by keying them. This year’s survey found 51 utilities (53.7%) manually entering payments. This is down from two years ago (62.8%), the highest of the four previous surveys.
Not surprisingly, 10 of the 13 most efficiently staffed utilities automate the mail payment process in some way, while 24 of the 28 least efficiently staffed utilities manually enter mail payments.
Phone credit card payments
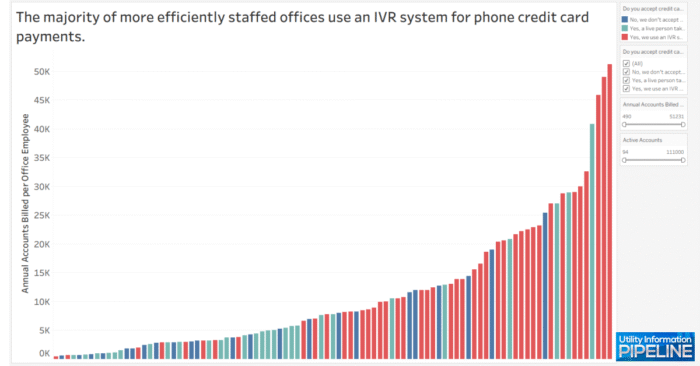
The next area the survey asked about is phone credit card payments. This can be an extremely laborious process if done by a person. The customer service representative must look up the account, inform the customer of the amount owed, take the credit card number, process the payment authorization, and finally enter the payment into the system.
This year, for the first time, every utility responding to the survey accepts credit cards!
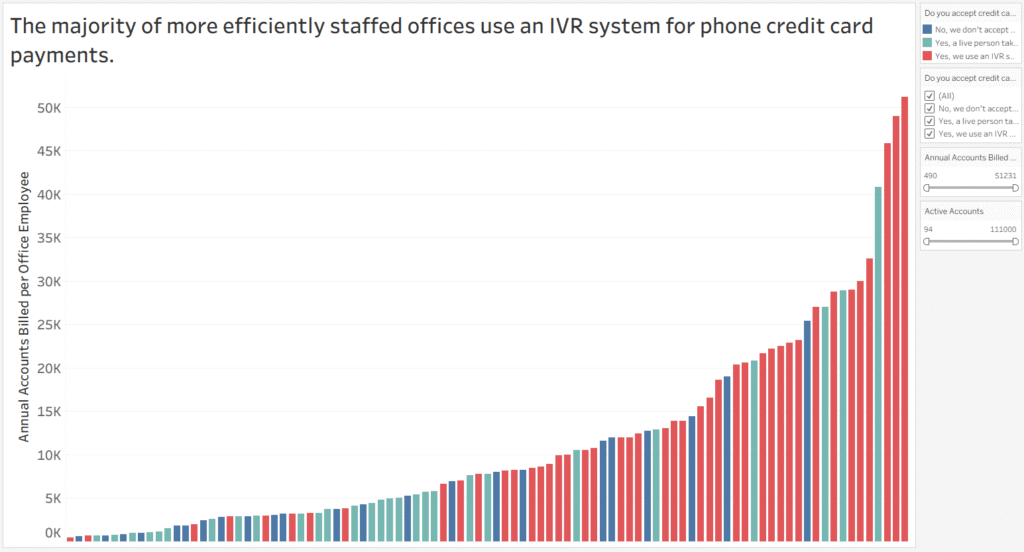
However, 23 utilities (representing 24.2%) don’t accept phone credit card payments. Of the rest, a live person takes the payment for 28 utilities (29.5%). and 44 use an IVR system (46.3%).
Once again, use of an IVR system continues to show a consistent, year-over-year increase since the inception of the Utility Staffing Survey. The use of IVR systems has increased each year, from 24.7% in 2016 to 46.3% this year.
If your office is still taking credit card payments in person, here’s a blog post explaining why this is not a good business practice.
Service order processing
The final area of the survey is service order processing. The survey asked whether utilities used paper or electronic service orders and whether they were integrated with their billing software or not.
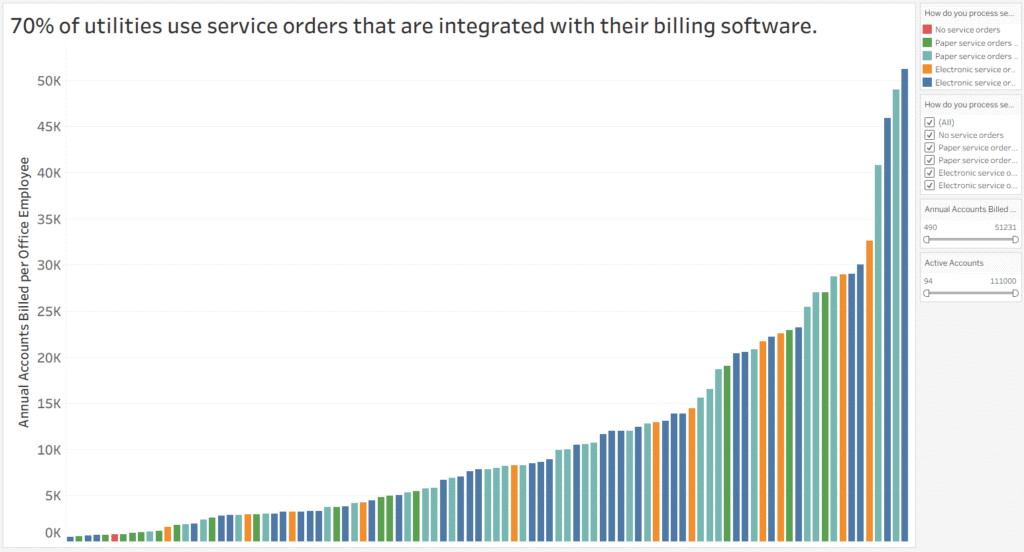
11 of the 13 most efficiently staffed offices use service orders that are integrated with their billing software, whether paper or electronic. 37 of the 95 utilities (representing 38.9%) use electronic service orders integrated with their billing software. This increased from 32.2% in 2024.
Staffing Survey trends
If you’re interested in trends over the course of Utility Staffing Surveys from 2016 to 2026, I wrote a blog post discussing this, and you can read it here.
Is your office adequately staffed?
If you’re unsure if your business office is adequately staffed, this is one of the things I can advise you on after completing a business review. Please give me a call at 919-673-4050 or email me at gary@utilityinformationpipeline.com for more information.