Two recent newsletters recapped the results of the 2022 Utility Staffing Survey. One question I’ve asked in each of the four Utility Staffing Surveys, but never analyzed, is what percentage of payments are received by each of the following methods:
- Walk-in
- Bank drafts
- Online
- Phone
The reason I’ve never tried to analyze this data is due to the disparity in responses. But this year I thought I’d try to tackle it.
Estimated or actual?
Due to the number of responses with nice, round numbers, I suspect quite a few are estimates or best guesses. Of the 88 responses to the survey, 28 of them (31.8%) didn’t provide any values. Of the other 60 responses, my very un-scientific guess is that 31 (35.2%) are actual values and the remaining 29 (33.0%) are estimates.
At this point you might be wondering how I determined actual vs. estimated values. It would be rare (but admittedly not impossible) for each percentage to be a multiple of 5, so I considered any responses where all of the values were a multiple of 5 (0, 5, 10, 15, etc.) to be an estimate.
Is there a trend?
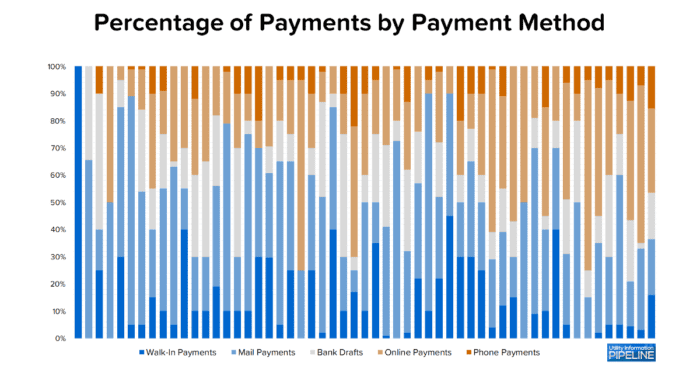
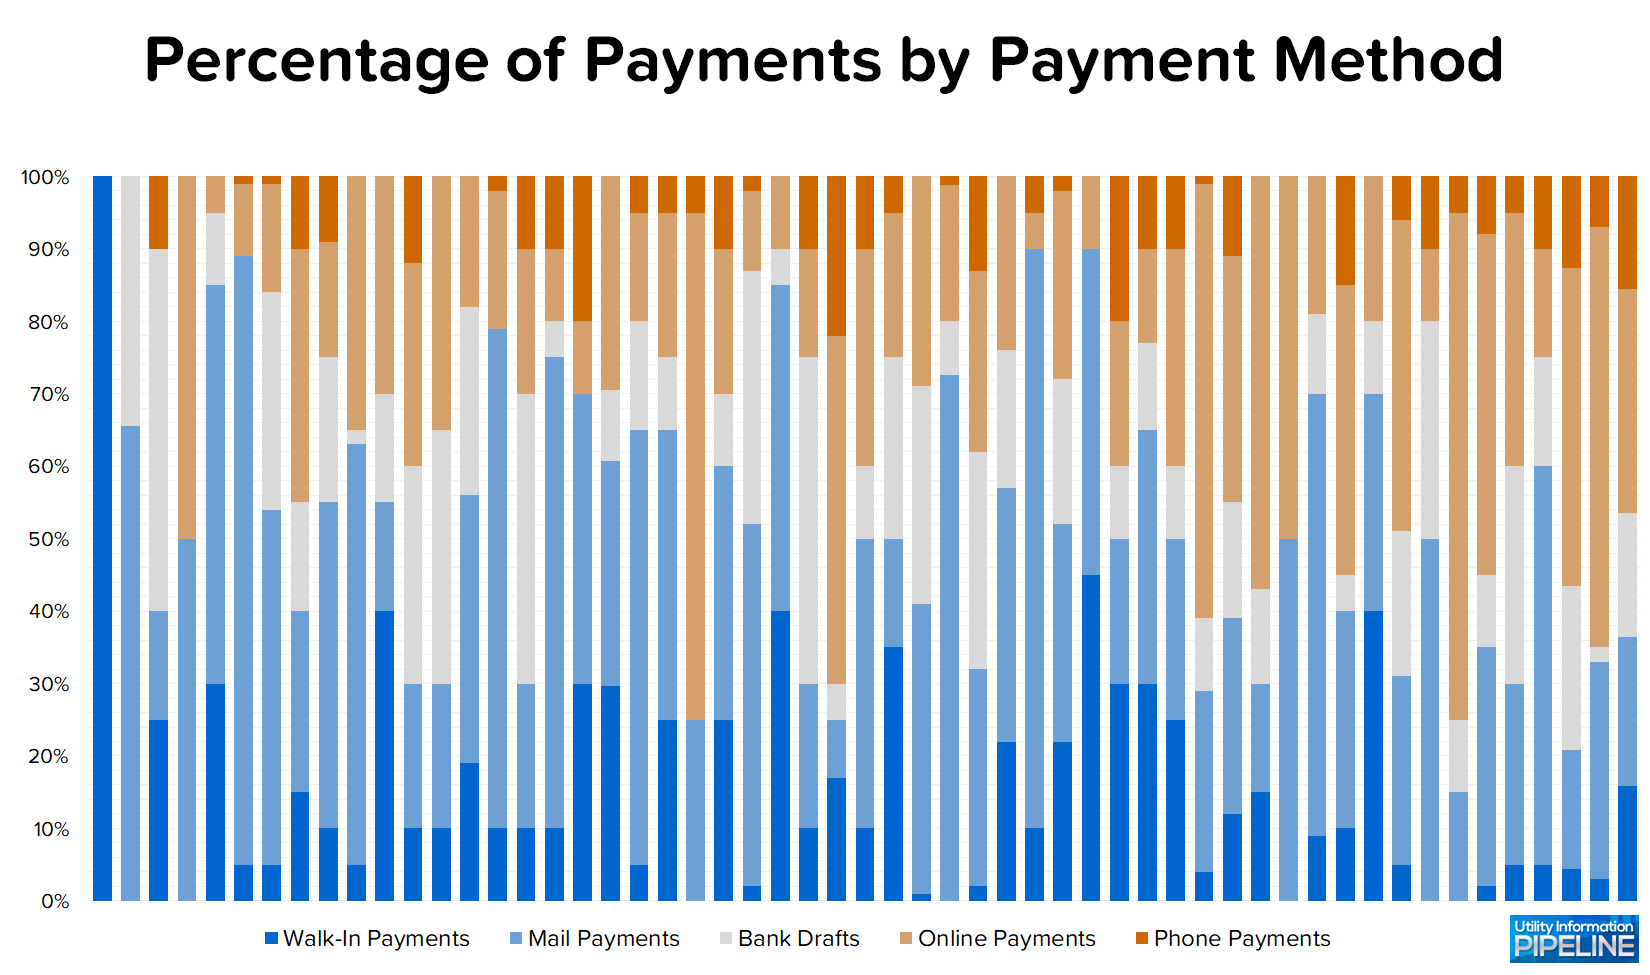
What I really wanted to know from this data was – is there a trend? For example, do more efficiently staffed offices have fewer walk-in payments? Or do they have more bank draft and online payments? I’m a visual person, so naturally I had to graph it.
Of the 60 utilities providing responses, five of them didn’t add up to 100%, so I had to exclude those. The remaining 55 utilities are shown below, in order from the smallest to largest values for Annual Accounts Billed per Office Employee (clicking on the graph will open a larger image in a new window):
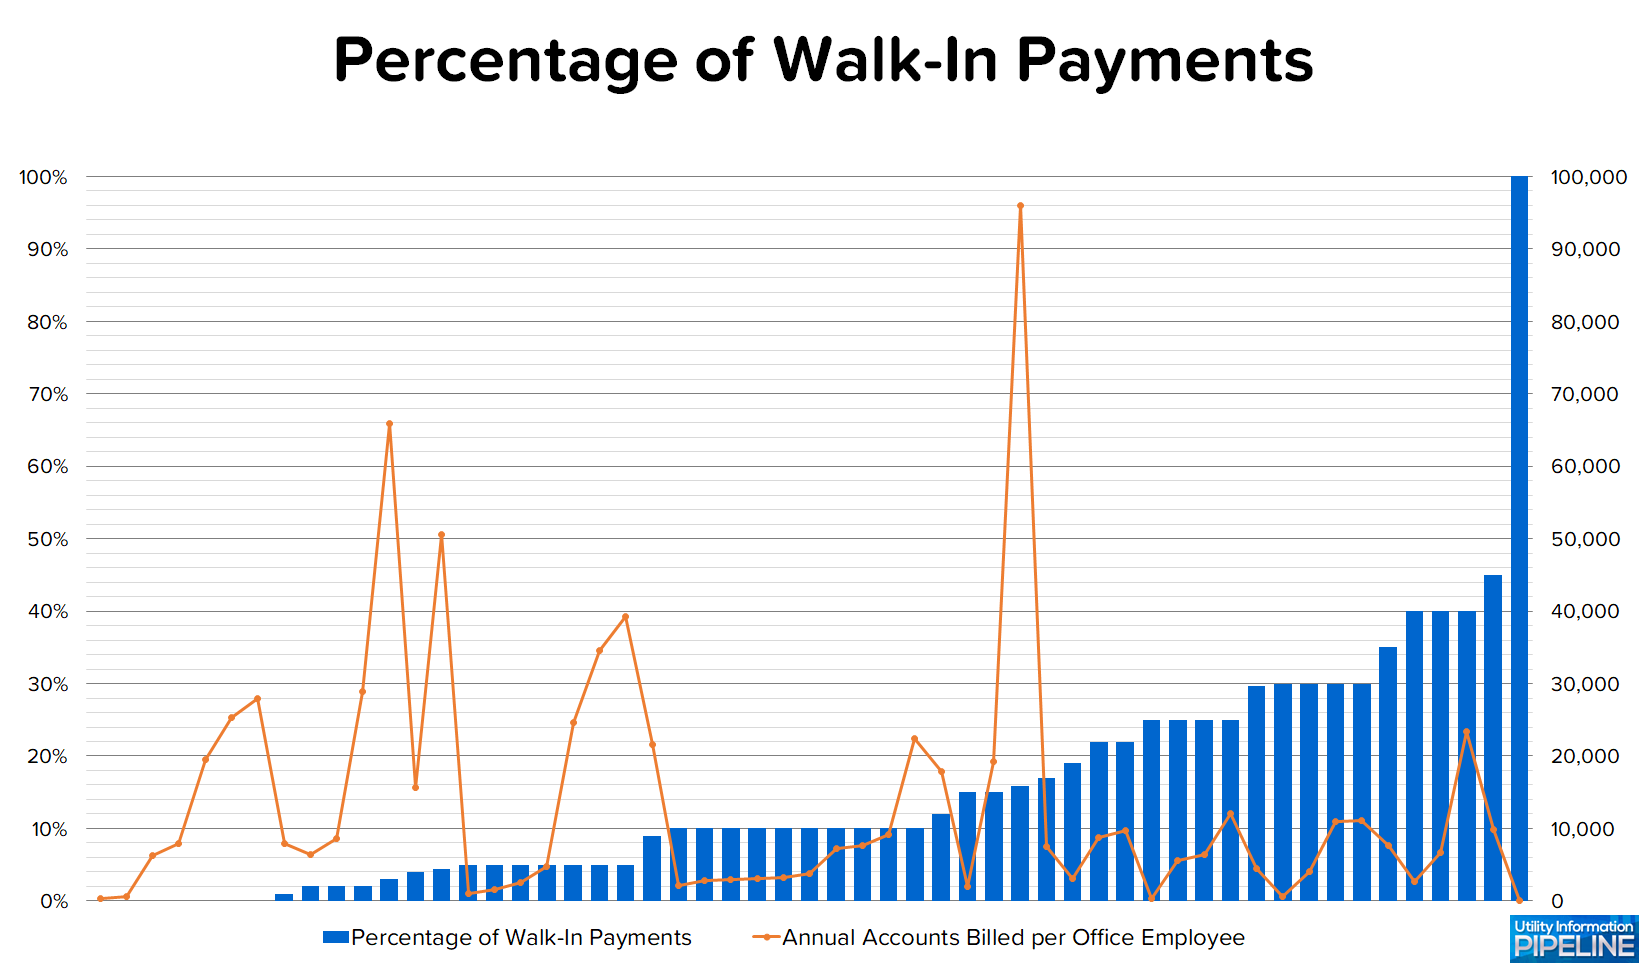
The least efficiently staffed office (admittedly, a very small utility) takes all their payments as walk-in payments.
On the other hand, eight of the nine most efficiently staffed offices only have 5% or less of their customers paying as walk-in customers. Ironically, the one utility in the top nine with walk-in payments of more than 5% is the most efficiently staffed office!
Taking it a step further
By plotting the percentage of walk-in payments against the Annual Accounts Billed per Office Employee, you can see where the most efficiently staffed offices tend to be on the left half of the graph, which represents walk-in payments of 10%, or less:
On the flip side, plotting bank drafts and online payments against the Annual Accounts Billed per Office Employee, shows a much more random pattern:
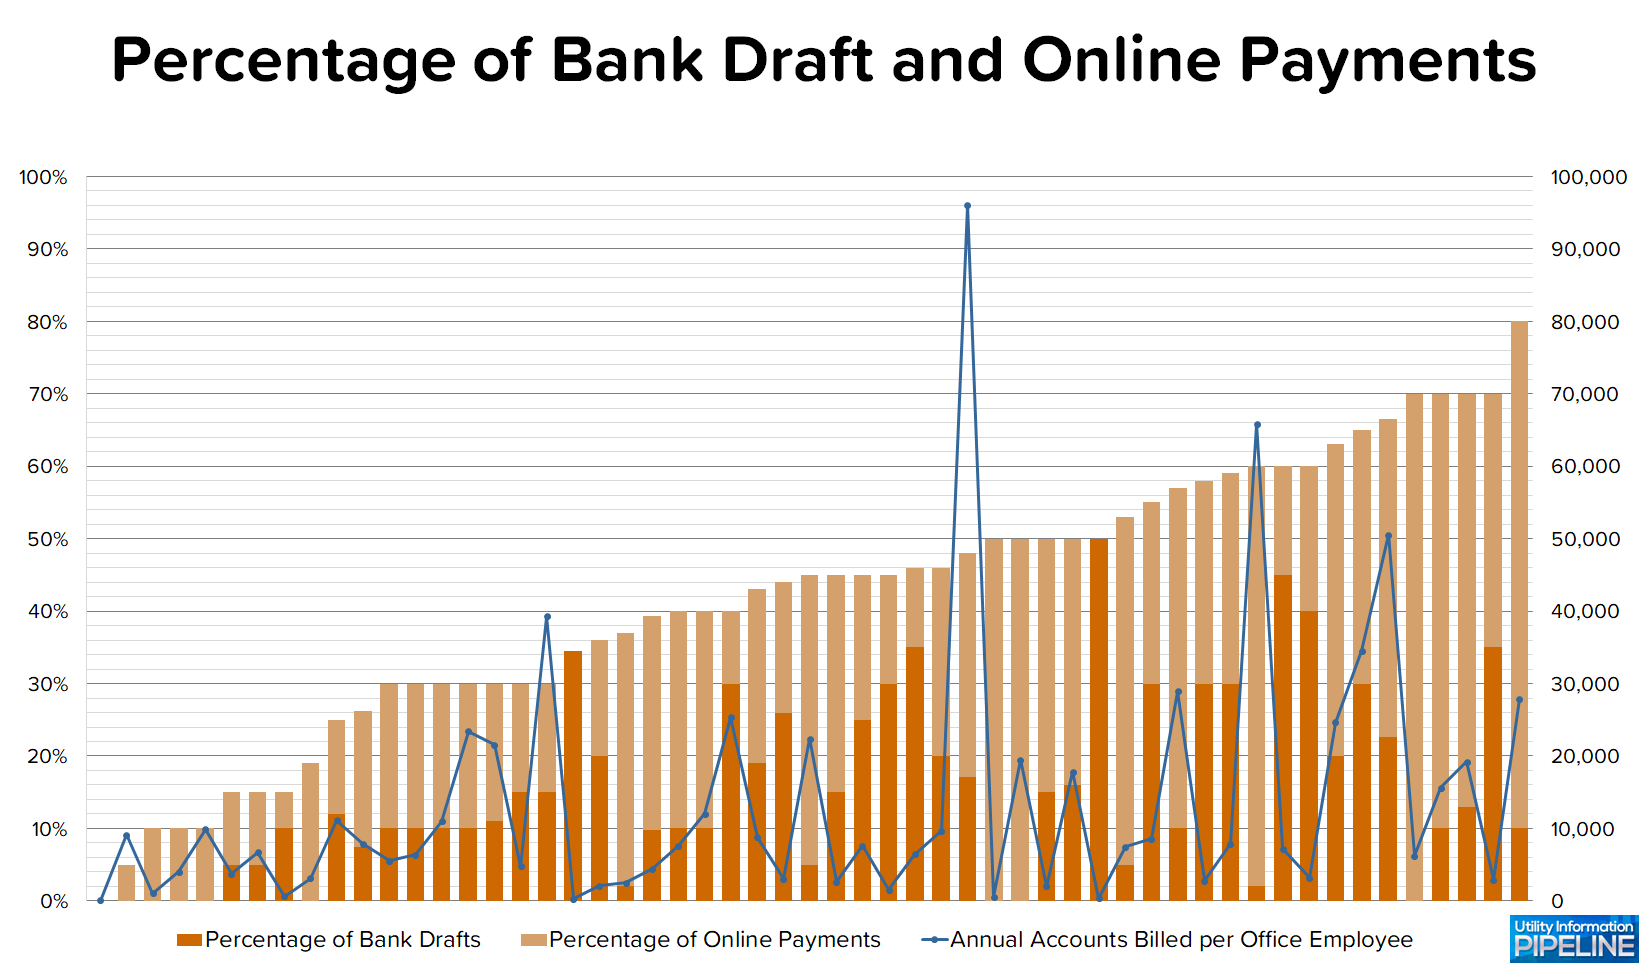
The office with the most bank draft and online payments, at 80%, is the ninth most efficiently staffed office, However, tied with a group of four utilities at 70% bank draft and online payments, are two utilities in the bottom half of efficiently staffed offices.
Why is this important to track…?
Back to the title of this blog post – why is this important to track? In my opinion, every utility should strive to minimize inefficient payment methods (i.e., walk-in and mail payments) and replace them with more efficient processes (bank drafts and online payments). If you aren’t tracking the trends, how can you know if you’re making any progress?
Are you processing payments efficiently?
If your office isn’t efficiently processing payments, or if you are unsure, please give me a call at 919-673-4050 or email me at gary@utilityinformationpipeline.com to learn how a business review could help you find out.

© 2023 Gary Sanders